Group Overview (Our Assets)
As an Asset Assembler, we are committed to pursuing sustainable growth by promoting the autonomous growth of existing assets and expanding our portfolio through disciplined, high-quality, and low-risk M&A.

- Japan
- NIPSEA
- DuluxGroup
- The Americas
- AOC
Features of Our Assets
Japan Group (Japan)

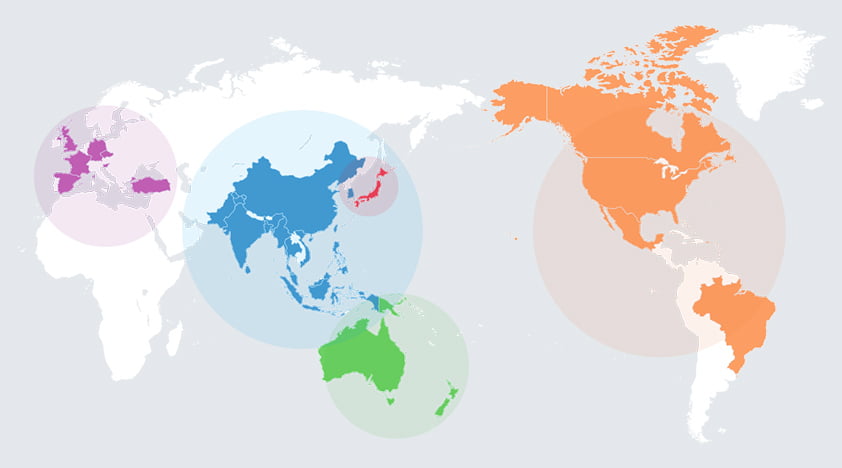
Japan Group engages in a broad range of businesses—including automotive coatings, decorative paints, industrial coatings, fine chemicals, and marine coatings—and maintains a leading position in the Japanese paint market, supported by its strong technological capabilities and brand strength.
NIPSEA Group (Asia)

NIPSEA Group is the driving force behind our Group’s growth, with operations spanning 22 countries and regions—primarily in Asia—and holding the No.1 market share in decorative paints in five of these markets.
DuluxGroup (Pacific/Europe)

DuluxGroup operates in 22 countries across the mature Pacific markets (Australia, New Zealand, and Papua New Guinea) and Europe. It holds the No.1 market share in decorative paints in four countries, including Australia, and ranks in the top three in six countries. DuluxGroup continues to deliver steady growth year after year and serves as a key driver of growth for our Group.
The Americas

Founded in 1925, Dunn-Edwards is a leading paint supplier in the southwestern United States, offering an extensive range of products and services for the professional decorative paints market.
AOC
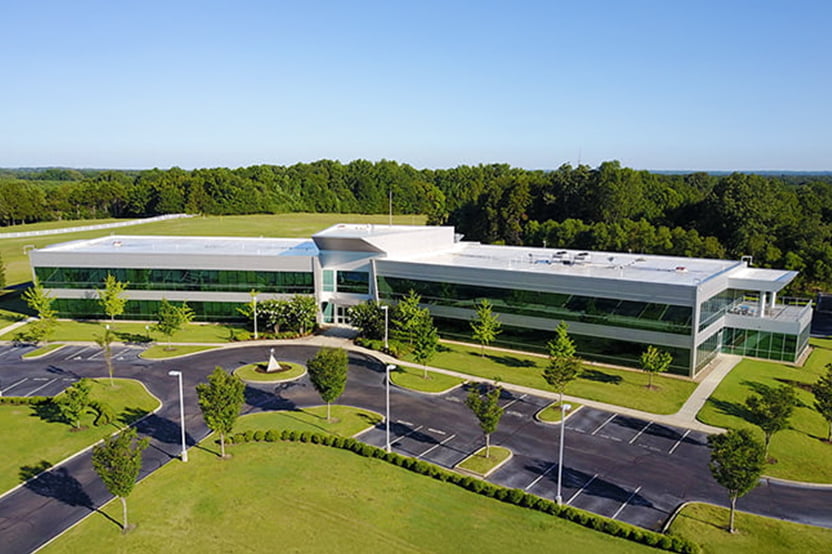
AOC is a U.S.-based global specialty formulator*, with operations primarily in the United States and Europe.
* Specialty formulator means the company is engaged in the formulation development, manufacturing, and distribution of unsaturated polyester (UP), vinyl ester (VE), and other solutions for CASE (Coatings, Adhesives, Sealants, and Elastomers), colorants, and composites. These products are used in construction, infrastructure, transportation, marine and other applications.


