Features of the asset
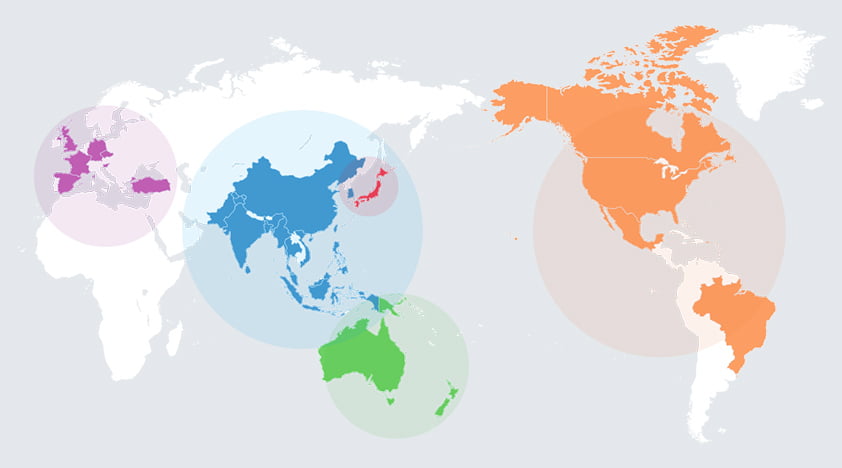
- Driving our Group’s growth as the dominant No. 1 brand in the Asian paint market
- Steadily expanding the adjacencies business through group-wide collaboration and platform leverage
- Aiming to achieve both growth that outperforms the market and profitability through the expansion of market share in each region
-
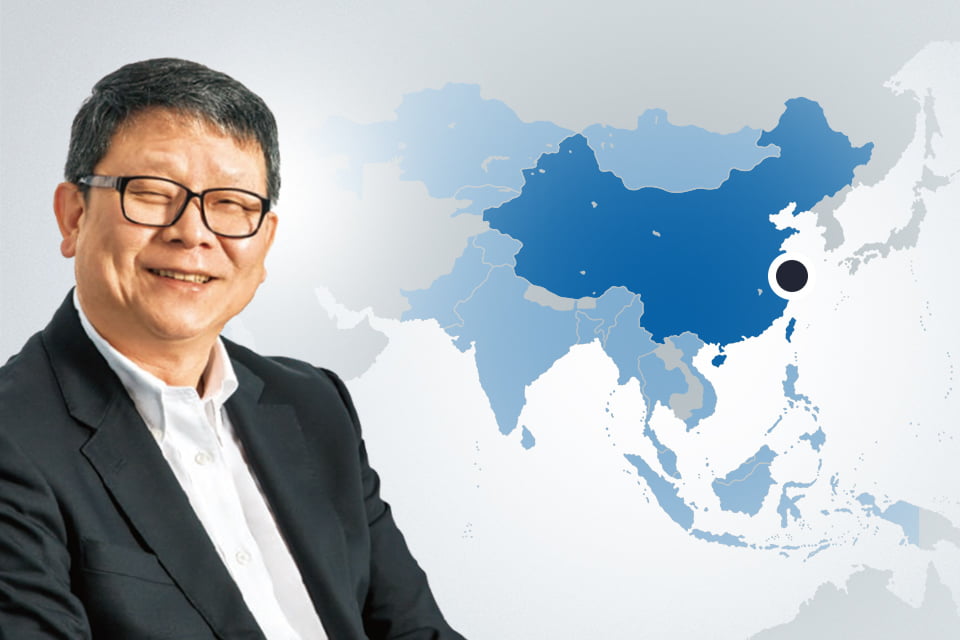
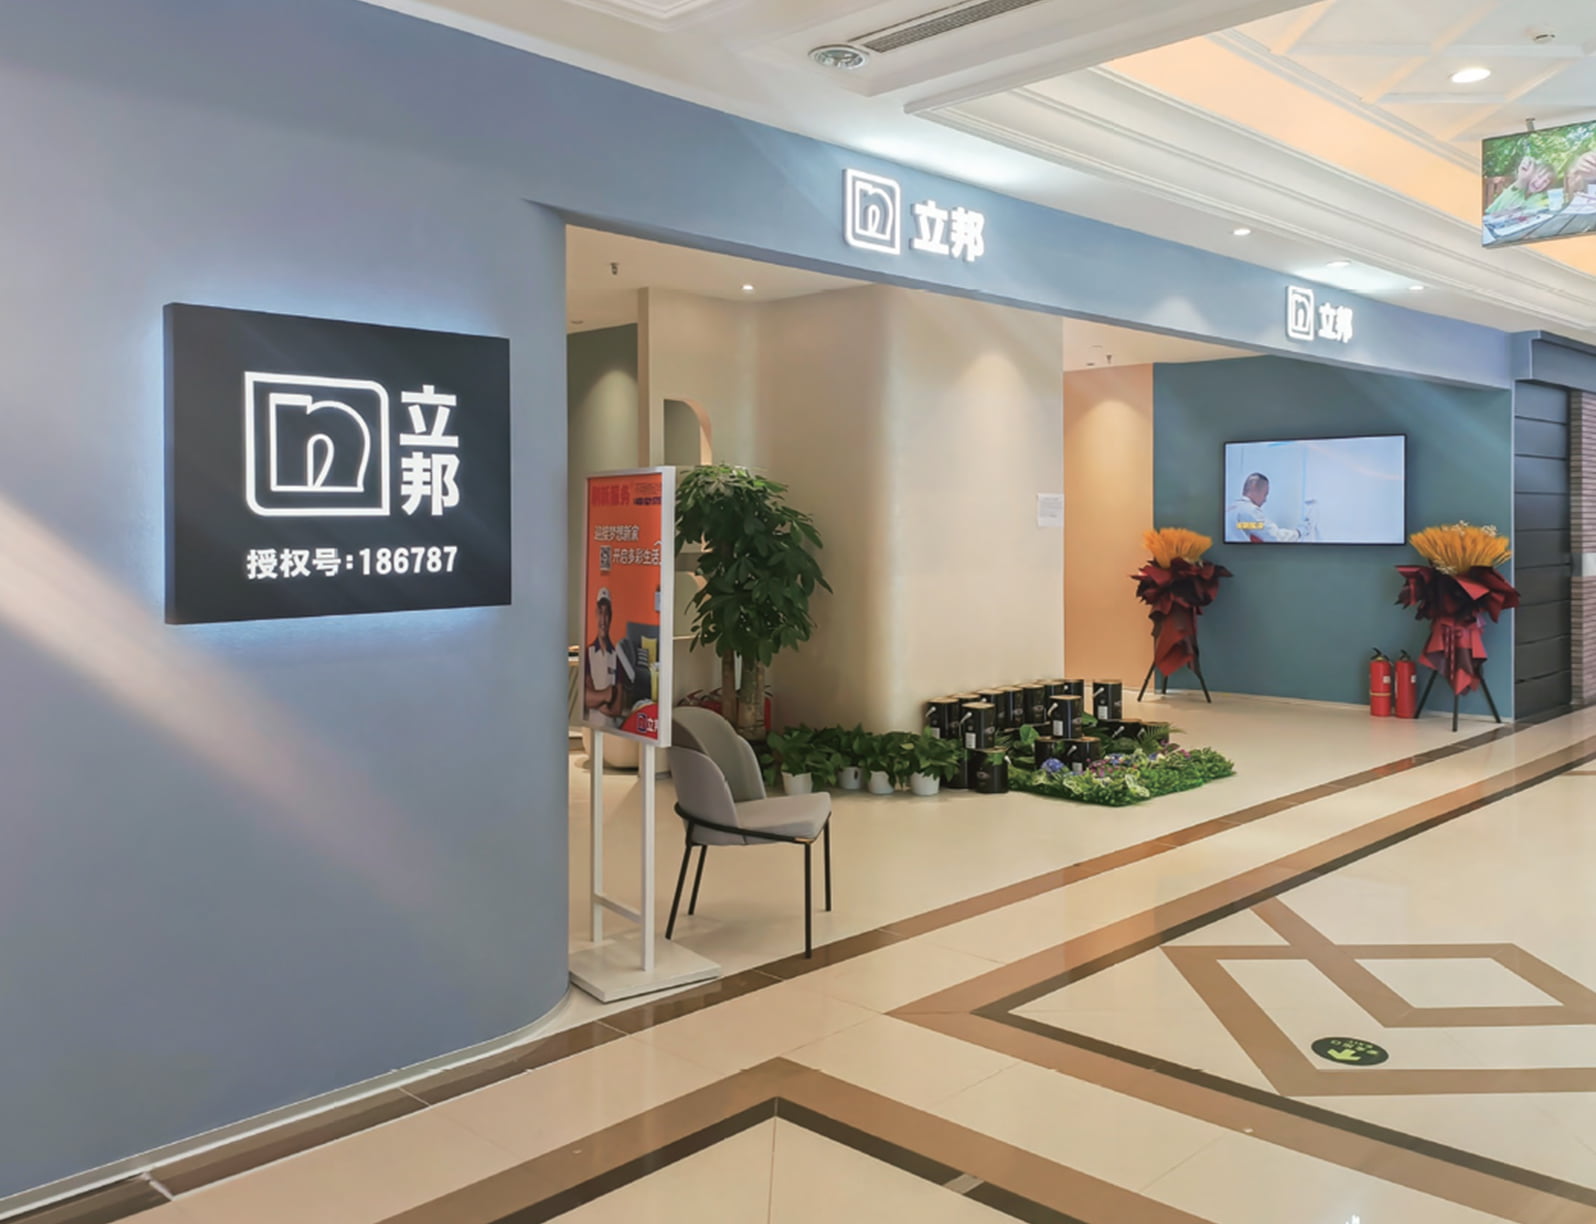
- Gaining significant market share by capitalizing on the strong brand the company has built over the years
- Focusing on capturing repainting demand arising from the renovation of existing homes, a future growth area
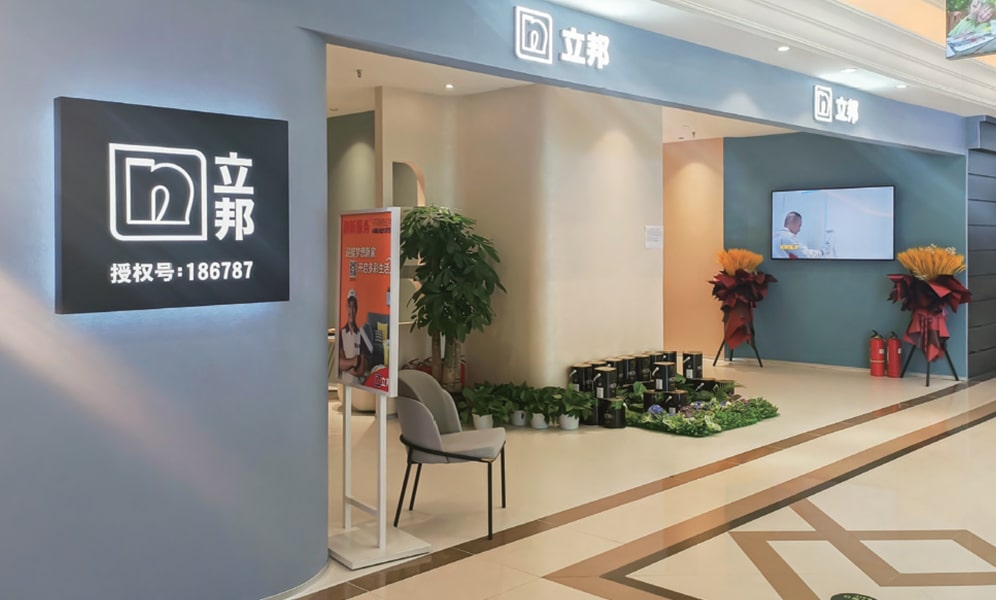
- Aiming to expand market share particularly in Tier 3-6 cities, with the goal of becoming the market leader
-
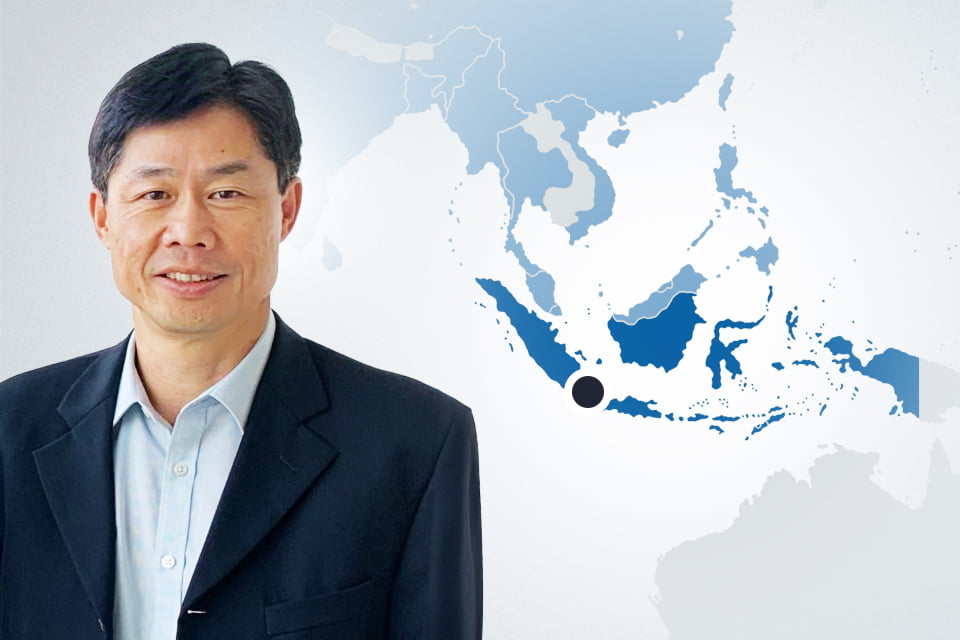
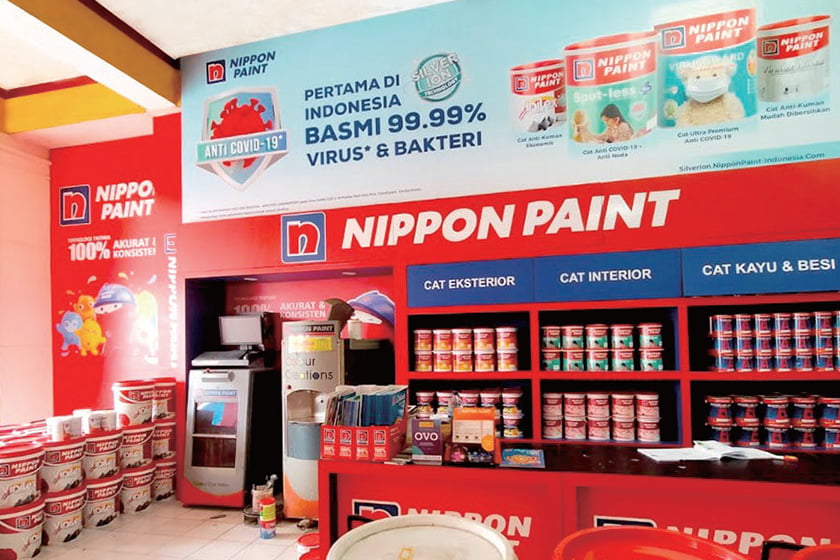
- Leading the decorative paints market as the top brand in fast-growing Indonesia
- Delivering the highest profitability within our Group
- Striving to become the No. 1 market leader in decorative paints through strategies that fully maximize our brand strength
-
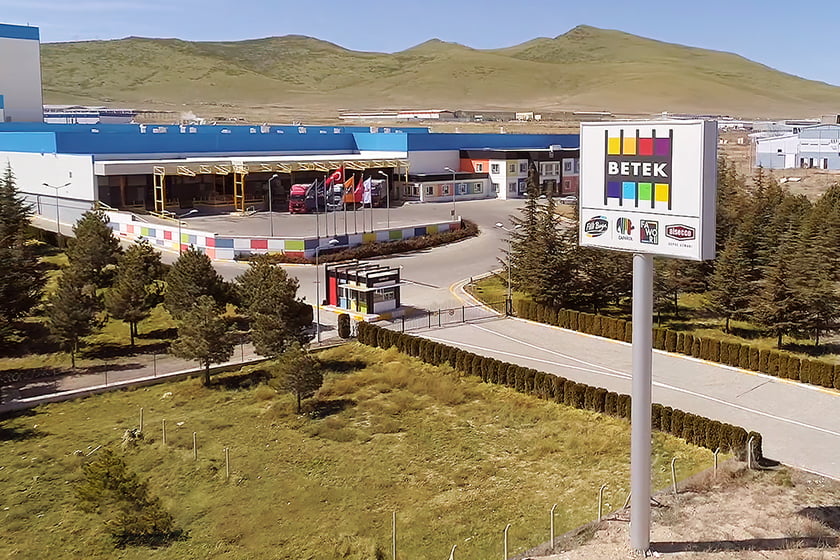
- Dominant No. 1 position in the Turkish decorative paints and ETICS markets
- Driving growth in the rapidly evolving market through a multi-brand strategy, leveraging strong brand power
- Aiming for sustainable growth by continuing the multi-brand strategy while expanding the range of SAF*, CC* and other adjacencies products
- SAF: Sealants, Adhesives & Fillers, CC: Construction Chemicals
Outstanding management teams instrumental in achieving continuous growth each year
Financial outcomes
-
2023 results
Automotive revenue increased from the previous year due to an increase in our market share with both automotive OEM and parts manufacturers, even though automobile production primarily among Japanese OEM manufacturers showed sluggish growth amid the expansion of the electric vehicle market. In the decorative segment, revenue also increased from the previous year due to the normalization of economic activities in China following the lifting of lockdowns, continued strong demand for interior paint for existing homes, and the flow-through of price increases in key markets such as Singapore, Malaysia, and Indonesia. Consequently, overall revenue rose by 8.9% YoY to JPY771.5 billion.
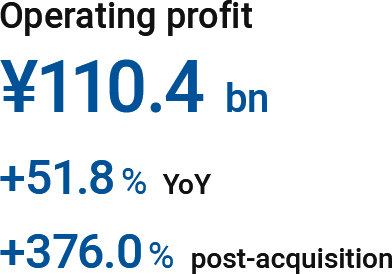
Operating profit surged by 51.8% YoY to JPY110.4 billion, primarily due to the effects of increased revenue and improved raw material cost contribution (RMCC) ratio, mainly resulting from the flow-through of price increases.Growth since the acquisition (2014)
Since the consolidation in 2014, NIPSEA Group has driven our Group’s performance by achieving growth that significantly surpass market and competitors, leveraging its strengths: (1) exceptional brand strength, (2) top-notch talent cultivated through the LFG corporate culture, (3) robust production and distribution networks, and (4) strong technological capabilities. Additionally, by sharing with Betek Boya and PT Nipsea the extensive expertise and technologies accumulated over the past 60 years, NIPSEA Group has helped these acquired companies achieve higher growth post-acquisition. Furthermore, NIPSEA Group has steadily expanded its adjacencies business by deploying the Selleys brand of DuluxGroup and acquiring Vital Technical.
Consequently, compared to the time of acquisition, revenue has surged by 226.2% and operating profit soared by 376.0%.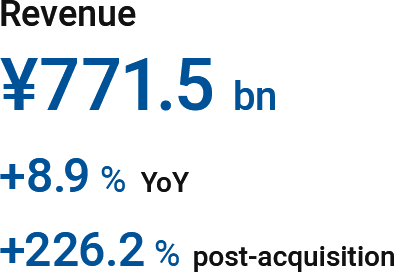
Trends in revenue, operating profit, and operating profit margin
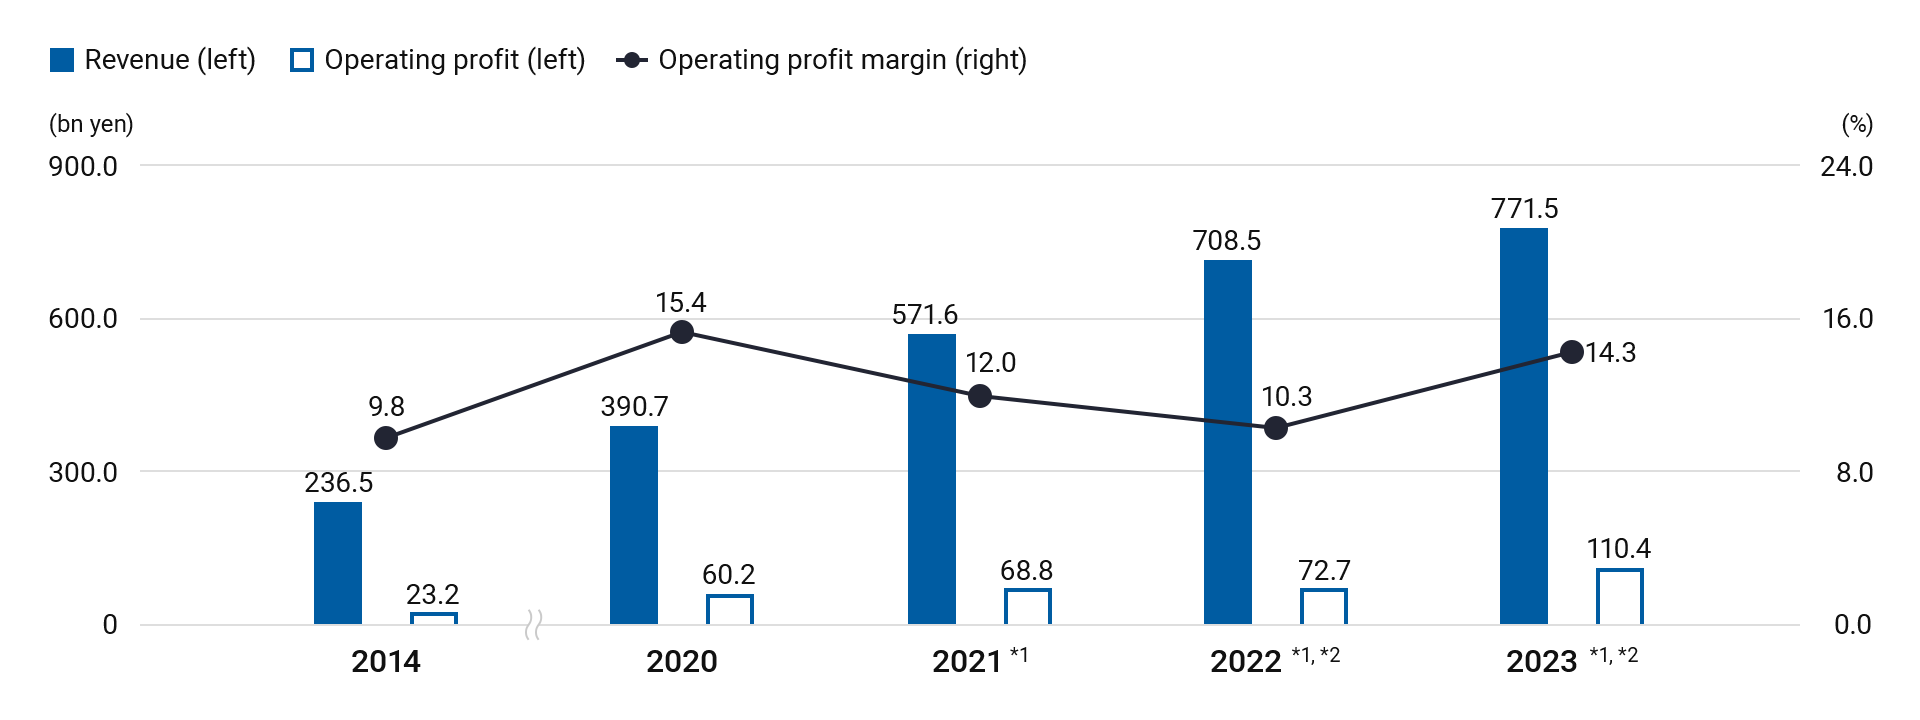
- Starting from FY2022 1Q, the business segmentation was changed. Figures from FY2021 onwards are based on the new segmentation and exclude the overseas marine business
- In accordance with IAS 29, hyperinflationary accounting was applied to Turkish subsidiaries starting from FY2022 2Q. Figures from FY2022 onwards reflect the application of hyperinflationary accounting
-
2023 results
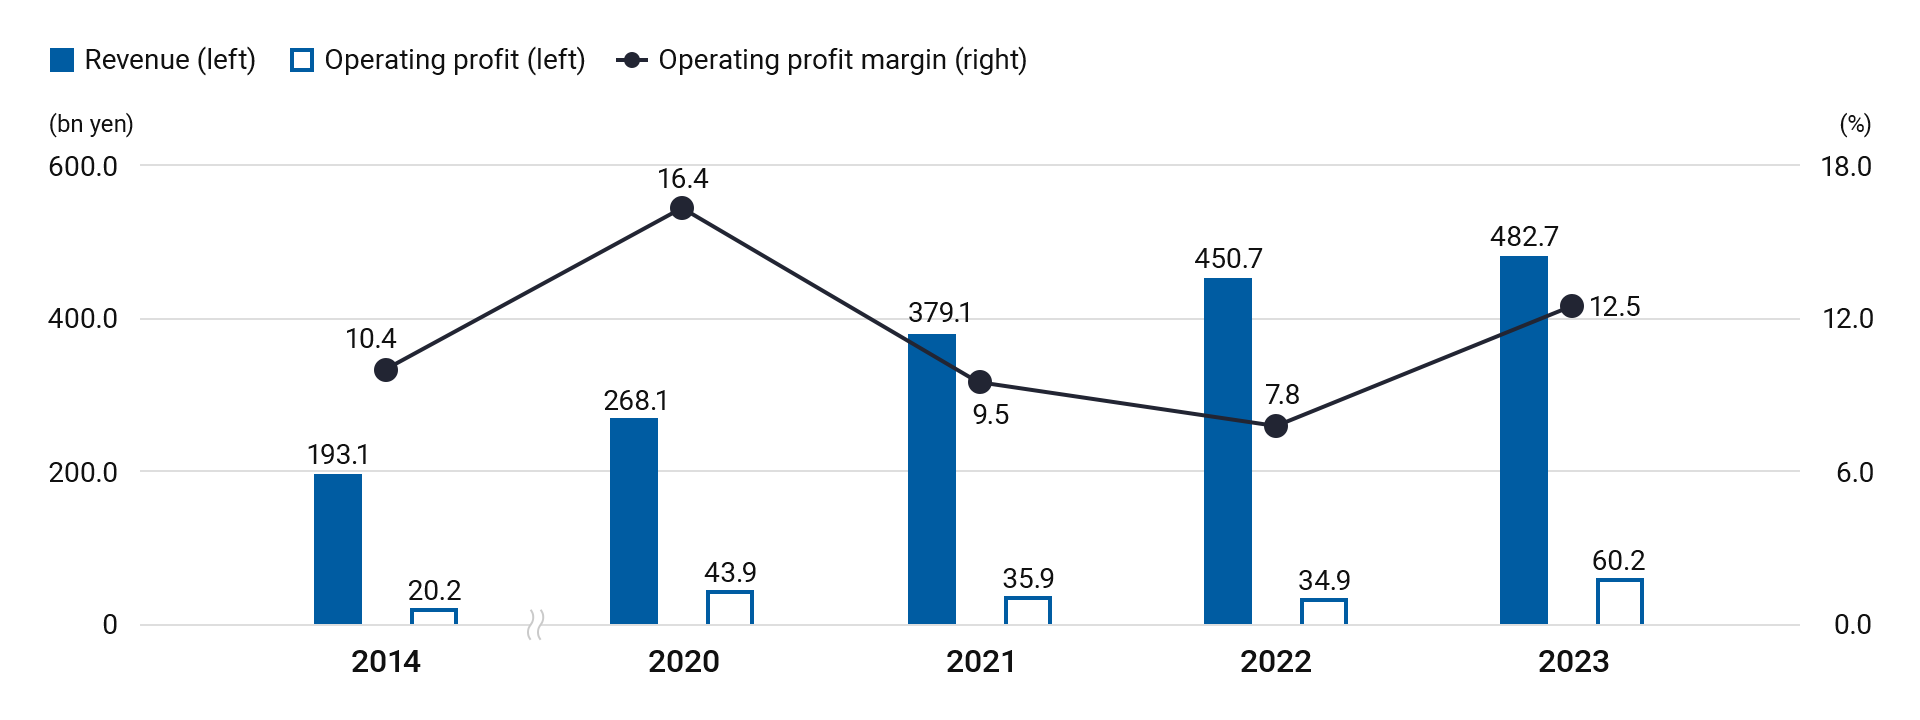
Automotive revenue was flat compared to the previous year due to sluggish growth in automobile production primarily among Japanese OEM manufacturers, amid the expansion of the electric vehicle market. In the decorative segment, revenue in the TUC segment increased by 13% (on a local currency basis), driven by strong growth in Tier 3-6 cities. Conversely, revenue in the TUB segment declined by 7% (on a local currency basis) due to the soft property market, despite the expansion of non-residential business. Revenue in the industrial segment declined due to the streamlining and screening of non-profitable customers, coupled with sluggish performance in the coil coating and powder coating businesses.
Consequently, overall revenue increased by 7.1% from the previous year to JPY482.7 billion.
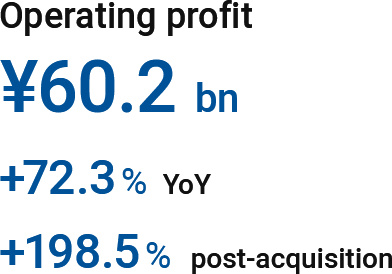
Operating profit soared by 72.3% YoY to JPY60.2 billion, due to the effects of increased revenue, an improved RMCC ratio, and the absence of a one-off provision recorded in the previous period.
Market share improved by 1 percentage point each for the TUC and TUB segments.Growth since the acquisition (2014)
Since the consolidation in 2014, NIPSEA China has consistently achieved strong growth each year, led by an outstanding management team with the LFG spirit and leveraging high credibility and comprehensive capabilities, including: (1) the LiBang brand with high Top of Mind recognition and reliability, (2) wide-ranging and continuously expanding business domains and product ranges to meet increasing customer needs, and (3) efficient production systems based on robust networks with manufacturing, sales, and stakeholders. In the TUC segment, NIPSEA China has aggressively expanded into Tier 3-6 cities in addition to maintaining high market share in Tier 0 and 1-2 cities. In the TUB segment, the company is diversifying its customer base to include non-residential and other sectors.
Consequently, revenue surged by 150.0% and operating profit soared by 198.5% compared to the time of acquisition.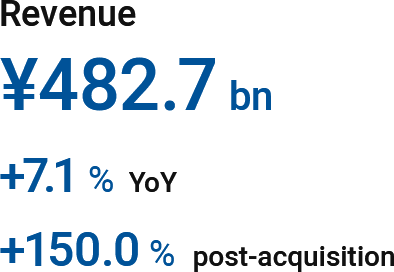
Trends in revenue, operating profit, and operating profit margin
TUC market share*1: 25% (+1.0pp YoY / +6.0pp vs. 2020) TUB market share*1: 9% (+1.0pp YoY / +1.0pp vs. 2020)
2020202120222023TUC202019%202123%202224%202325%TUB20208%20219%20228%20239%- Starting in 2023, the Chinese decorative paints segment was reclassified into TUC and TUB segments based on distribution channels. Following the reclassification, the market share was adjusted according to the definitions of the TUC and TUB segments.
-
2023 results
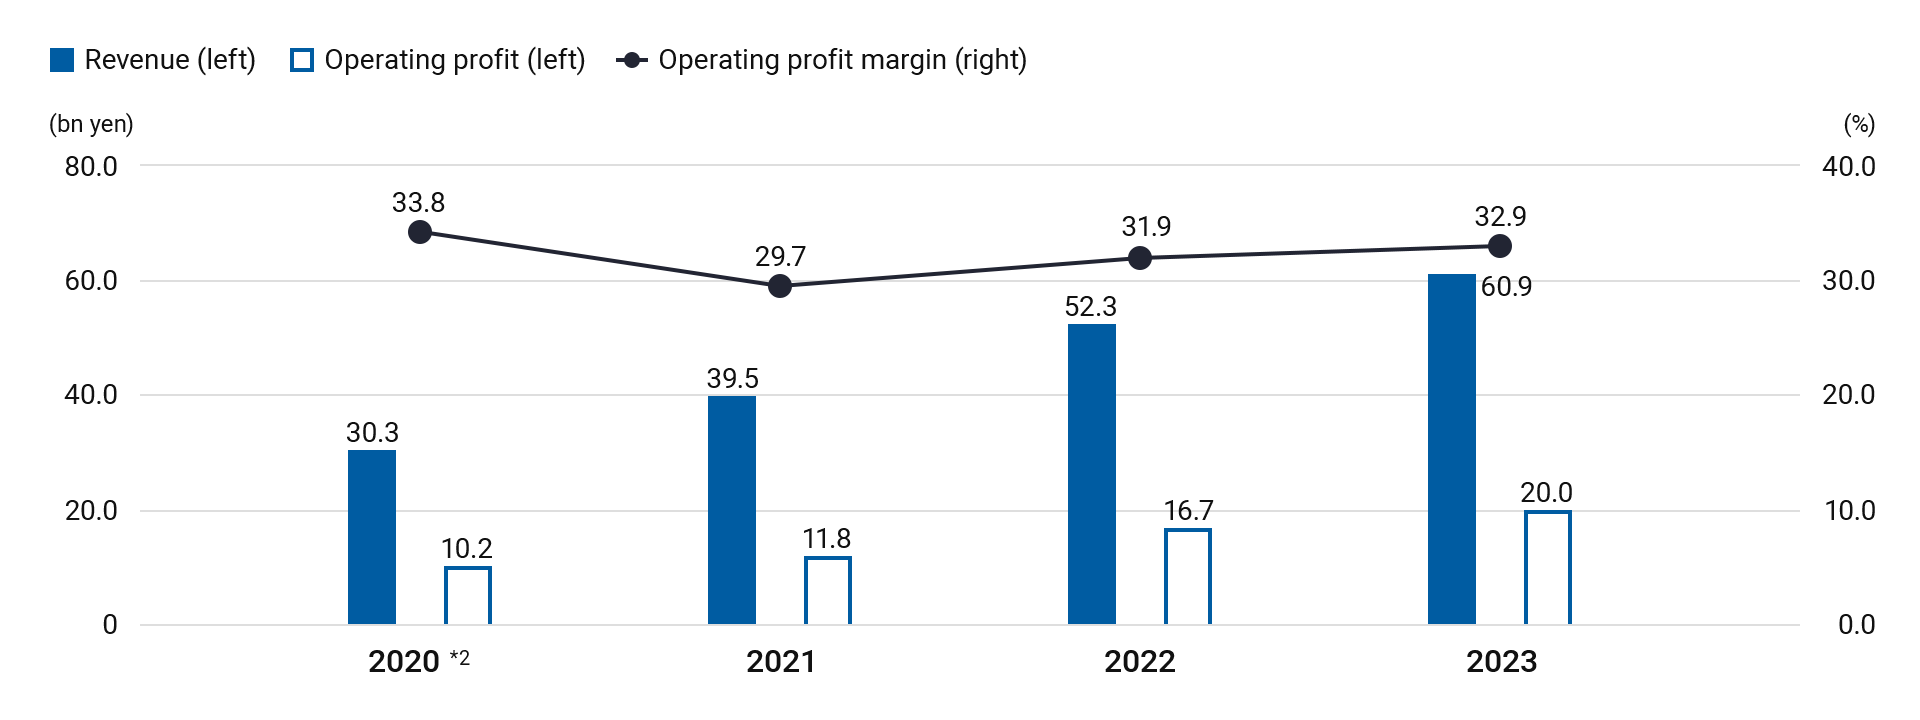
Revenue increased by 16.3% YoY to JPY60.9 bn, driven by robust growth due to higher sales volumes, the flow-through of price increases, the expansion of distribution network, the addition of new distributors, and the wider deployment of CCM machines.
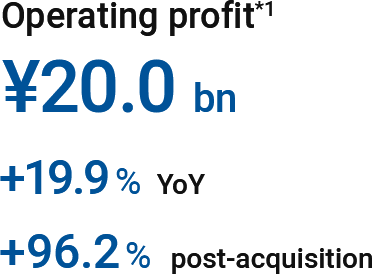
Operating profit increased by 19.9% YoY to JPY20.0 bn, attributed to higher sales and improved Raw Material Cost Contribution (RMCC) ratio.
PT Nipsea’s market share in decorative paints increased by 1 percentage point from 2022 to 19%, maintaining its position as the second-largest player.Growth since the acquisition (2021)
Under the guidance of excellent management team practicing NIPSEA-style management, PT Nipsea has achieved higher earnings growth and market share expansion compared to pre-acquisition levels by leveraging the following strengths: (1) an extensive and growing network of production bases and distribution channels across Indonesia, (2) highly recognized decorative paint brands, (3) the largest CCM supply framework in Indonesia, and (4) a strong support system cultivated through collaborations with global OEM manufacturers.
As a result, revenue surged by 100.9% and operating profit soared by 96.2% compared to pre-acquisition levels.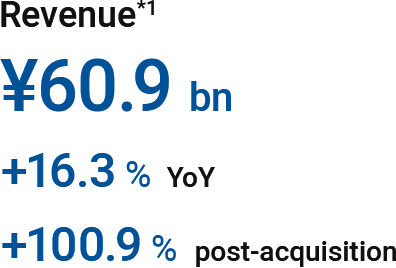
Trends in revenue, operating profit, and operating profit margin
Market share (decorative)*3: 19% (+1pp YoY / +2pp post-acquisition)
2020202120222023202017%202117%202218%202319%- Segment basis (after elimination of inter-segment transactions and after PPA)
- Pro-forma figures
- NPHD estimates
-
2023 results
Revenue increased by 6.7% YoY to JPY75.2 billion, driven by the flow-through of price increases to counter inflation and other factors and successful execution of brand strategy.
Operating profit rose by 33.8% YoY to JPY8.2 billion, benefitting from revenue growth and a significant improvement in the Raw Material Cost Contribution (RMCC) ratio, which offset the effects of hyperinflationary accounting and increased advertising and SG&A expenses.
Betek Boya achieved a 1 percentage point increase in market share to 35%, despite limited sales volume growth due to the hyperinflation, maintaining its position as the market leader.Growth since the acquisition (2019)
By leveraging our Group’s low-cost financing capability, Betek Boya repaid all its high-interest-rate borrowings. This enabled the company to allocate the generated cash to actively invest in marketing and other promotional activities. Additionally, by utilizing NIPSEA Group’s expertise in driving growth in emerging markets and leveraging the NIPPON PAINT brand to launch premium brands, Betek Boya has achieved significantly higher earnings growth and market share expansion compared to pre-acquisition levels.
As a result, compared to the time of acquisition, revenue surged by 160.9% and operating profit soared by 147.7%.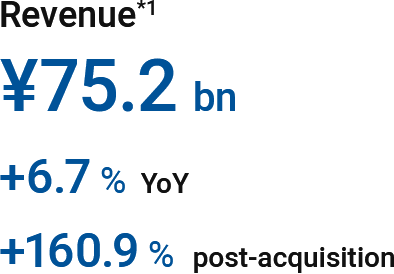

Trends in revenue, operating profit, and operating profit margin
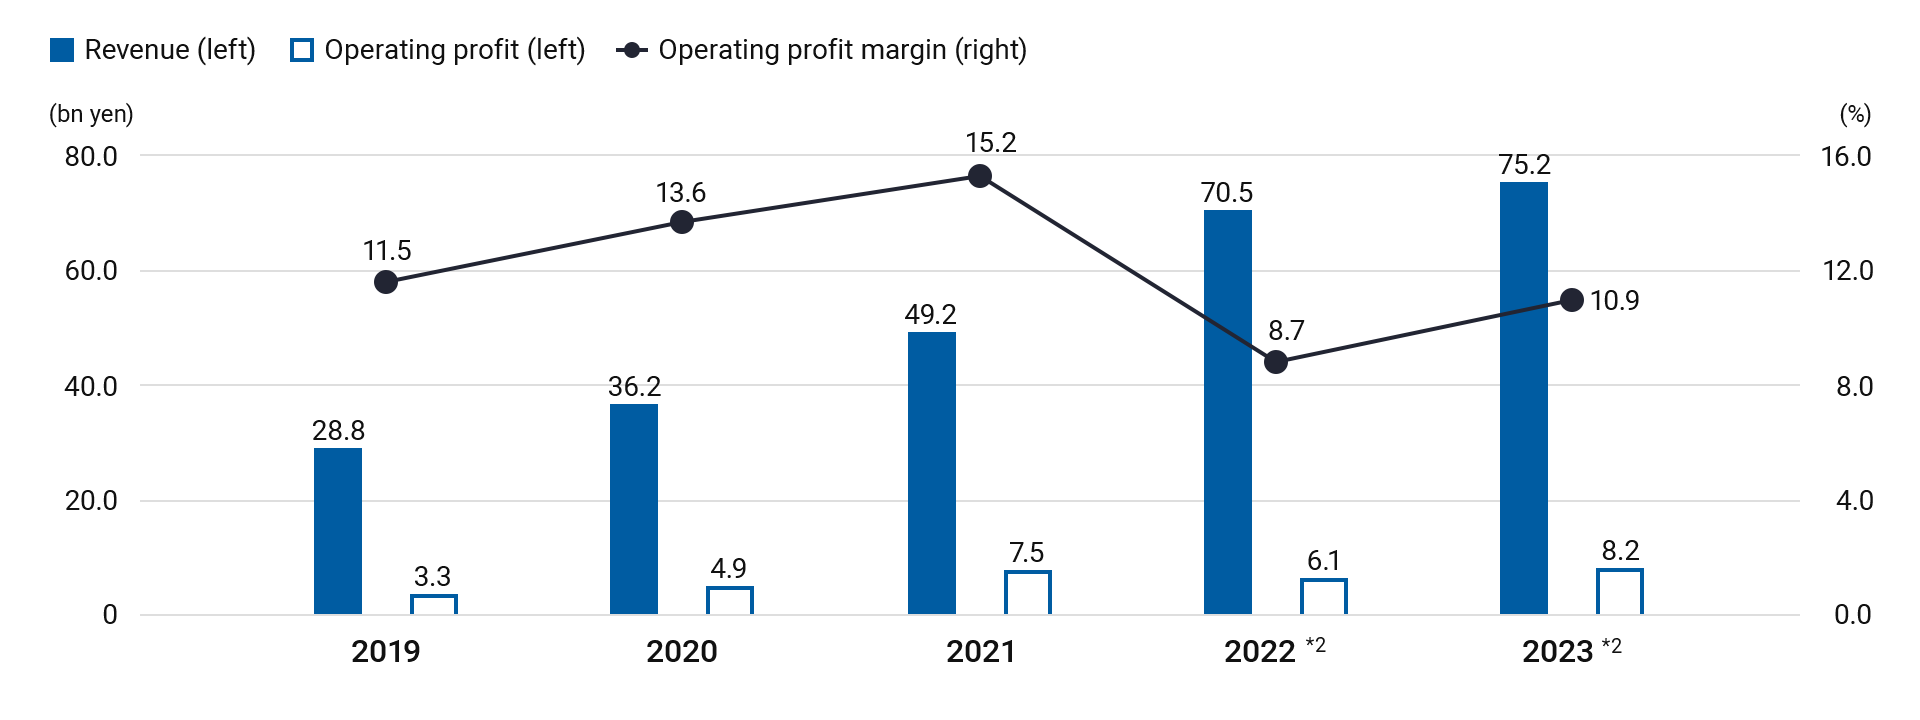
Market share*3: 35% (+1pp YoY / +8pp vs. post-acquisition)
20192020202120222023201927%202030%202134%202234%202335%- Segment basis (after elimination of inter-segment transactions and after PPA)
- In accordance with IAS 29, hyperinflationary accounting was applied to Turkish subsidiaries starting from FY2022 2Q. Figures from FY2022 onwards reflect the application of hyperinflationary accounting.
- Internal estimates
Non-financial outcomes (2023 results)
-
 Human resources/organizations
-
Many initiatives to improve the gender balance
- Ratio of female employees: 25.2% (+0.2pp YoY)
- Ratio of women in managerial positions: 26.6% (+1.4pp YoY)
-
Increase of employee engagement
- Employee satisfaction (2022): 75.0%
 Brands
-
Increase the recognition and trust in the NIPPON PAINT brand
- Listed on Brand Finance’s Top 10 Most Valuable Paint Brands in the World for the third consecutive year
 Nature/environment
-
Initiatives aimed at reducing GHG emissions
- GHG emissions (Scope 1 and 2): -33% YoY
-
Many initiatives to improve the gender balance
-
 Customer base
-
Comprehensive distribution network to support growth in the decorative paints business
- Number of stores: c. 290,000 (+179% YoY), Number of stores with CCM machines: c. 19,000 (+73% YoY)
-
Strategic partnerships with Chinese real estate developers
- Selected as the No. 1 paint brand by the top 500 Chinese real estate developers for 13 consecutive years
 Brands
-
Continuous investment in strengthening the brands’ statuses
- Achieved a 51% Top of Mind score among consumers
 Nature/environment
-
Controlled water usage through proper management following voluntary standards
- 90% reduction in water discharge at the Shanghai factory
-
Comprehensive distribution network to support growth in the decorative paints business
-
 Customer base
- Enhanced customer services through the largest number of CCM machines deployed in Indonesia
- Strengthened relationships with fishing communities by providing samples of ship repair coatings
 Brands
-
Continuous investments in enhancing brand awareness and positioning
- Achieved a 26% Top of Mind score among consumers for decorative paints
-
 External partners
-
“Next-generation dealer” program and loyalty program
- Number of stores implementing these programs: c. 380 (+9% YoY)
-
Strengthened relationships with dealers and professional painters through the “Filli Ustam” loyalty program
- Number of professional painters using this program: c. 2,700 (+8% YoY)
 Brands
-
Strengthened position as the market leader
- Maintained the No.1 position in the decorative paints market for about 20 years
-
“Next-generation dealer” program and loyalty program

