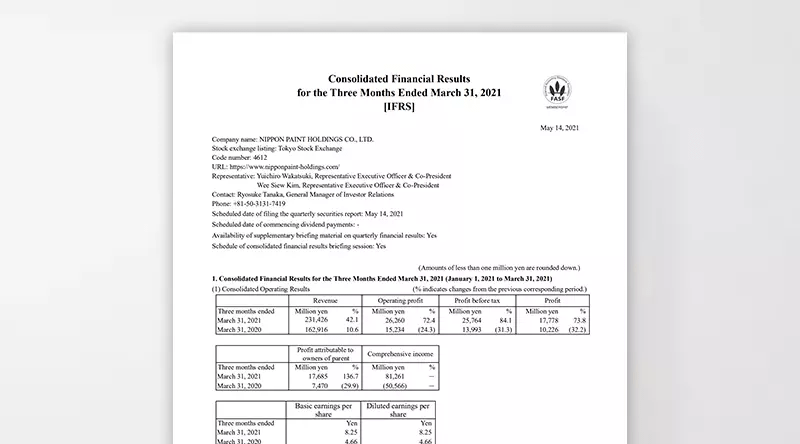

Latest Results
Overview of Operating Results for the Fiscal Year Ended December 31, 2025
(January 1, 2025 – December 31, 2025)During the fiscal year ended December 31, 2025, Nippon Paint Group recorded consolidated revenue of ¥1,774,231 million, representing an increase of 8.3% compared with the previous fiscal year. This increase was primarily attributable to contributions from LSF11 A5 TopCo LLC (AOC), including AOC, LLC, a global specialty formulator, and its affiliated companies, following the completion of the acquisition in March 2025. Consolidated operating profit increased by 38.1% year on year to ¥257,104 million. Although a goodwill impairment loss was recorded for the Cromology Group—based on the results of an impairment test reflecting the latest business environment amid deteriorating conditions in Europe—this was more than offset by revenue growth, improved raw material cost contribution ratio and SG&A ratio, and a gain on the transfer of non-current assets at the Tokyo Office. As a result, consolidated profit before tax increased by 39.1% to ¥250,565 million, and profit attributable to owners of the parent rose by 42.8% to ¥179,800 million.

Revenue from automotive coatings increased compared with the previous year, reflecting a recovery in automobile production. Revenue from industrial coatings also increased, as the impact of weak market conditions was more than offset by the pass-through of price increases. Revenue from decorative paints declined, despite initiatives to expand sales of high value-added products, including new products, due to a slowdown in renovation projects caused by inflation.
As a result, consolidated revenue increased by 1.1% year on year to ¥205,360 million. Consolidated operating profit rose by 44.6% to ¥28,125 million, supported by higher revenue, improved raw material cost contribution ratio and SG&A ratio, and a gain on the transfer of non-current assets at the Tokyo Office.
Revenue from automotive coatings in the NIPSEA segment increased compared with the previous year, as higher automobile production in China and strong sales to Chinese local automakers more than offset flat automobile production in Thailand. Revenue from decorative paints decreased, as increased sales volumes in China and key markets such as Malaysia and Singapore were offset by weak consumer sentiment and other adverse market conditions in other parts of Asia.
As a result, consolidated revenue decreased by 2.9% year on year to ¥887,462 million, while consolidated operating profit increased by 17.3% to ¥144,021 million.
Revenue from decorative paints increased compared with the previous fiscal year, reflecting modest market share gains and the pass-through of price increases in the Pacific region, while softer market conditions in Europe were offset by growth in other markets. Revenue from the adjacencies business was largely stable due to contributions from small-scale acquisitions and the pass-through of price increases, which more than offset the impact of sluggish market conditions in the Pacific and Europe.
As a result, consolidated revenue increased by 1.7% year on year to ¥405,173 million. Consolidated operating profit decreased by 13.5% to ¥34,943 million, primarily due to the recognition of a goodwill impairment loss, recorded following an impairment test conducted reflecting the latest business environment for Cromology Group amid deteriorating market conditions in Europe.
*DuluxGroup Limited is an Australian company that holds the rights to the Dulux® trademark exclusively in Australia, New Zealand, Papua New Guinea, Samoa and Fiji. DuluxGroup Limited is not affiliated with, nor connected to, the owners of the Dulux® trademark in other regions and does not sell Dulux® products outside these designated markets.

Revenue from automotive coatings decreased compared with the previous fiscal year, reflecting a decline in automobile production in the United States. Revenue from decorative paints also declined, due to reduced demand stemming from economic uncertainty in the United States and continued softness in the housing market.
As a result, consolidated revenue decreased by 3.1% year on year to ¥118,952 million, and consolidated operating profit declined by 17.8% to ¥6,393 million.
From March 2025, AOC’s income and expenses have been included in the Group’s consolidated results. Revenue from the adjacencies business was affected by weaker market demand compared with the prior year, primarily due to soft macroeconomic conditions.
As a result, consolidated revenue amounted to ¥157,282 million, and consolidated operating profit was ¥48,585 million.
Revenue Composition
- Revenue by Segment
-
Unit: ¥ million
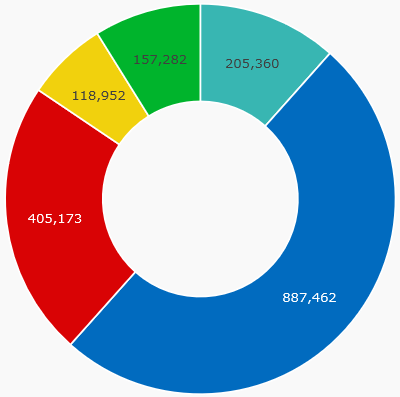
- ■Japan: 205,360
- ■NIPSEA: 887,462
- ■DuluxGroup: 405,173
- ■Americas: 118,952
- ■AOC*: 157,282
*Results for 10 months
- Revenue by Business
-
Unit: ¥ million
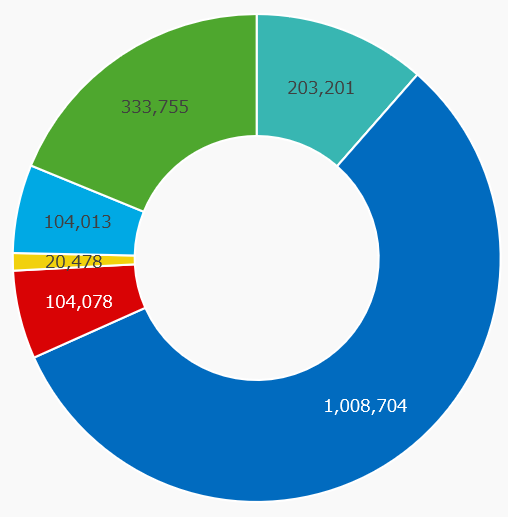
- ■Automotive Coatings: 203,201
- ■Decorative Paints: 1,008,704
- ■Industrial Coatings: 104,078
- ■Fine Chemicals: 20,478
- ■Other Paints: 104,013
- ■Other Adjacent Businesses: 333,755
《Revenue》
Revenue growth has accelerated due to the cumulative impact of multiple M&A transactions carried out since 2017, in addition to significant growth in the architectural coatings business in Asia, particularly in China. In FY2025, contributions from AOC, which includes AOC, LLC, a global specialty formulator whose acquisition was completed in March 2025, resulted in revenue growth for the eighth consecutive year and the highest level on record.
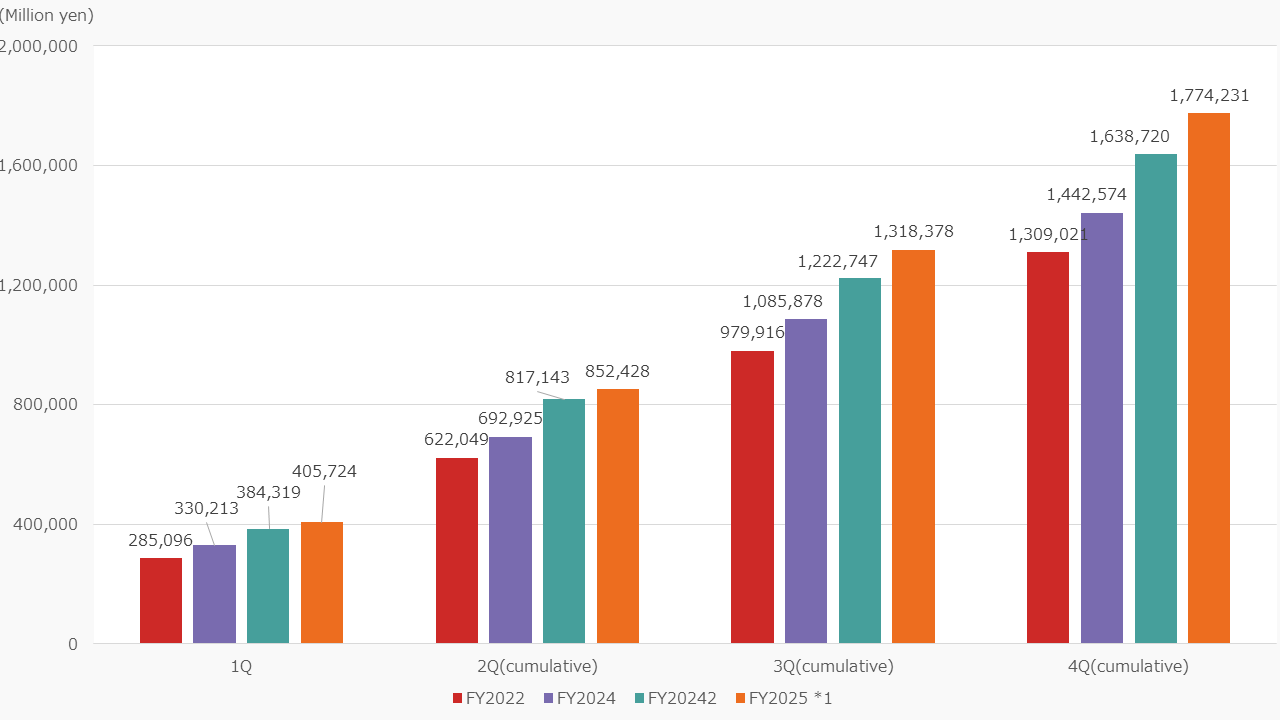
(Unit: ¥ million)
|
|
1Q | 2Q (Cumulative) | 3Q (Cumulative) | Full Year |
|---|---|---|---|---|
| FY2022 | 285,096 | 622,049 | 979,916 | 1,309,021 |
| FY2023 | 330,213 | 692,925 | 1,085,878 | 1,442,574 |
| FY2024 | 384,319 | 817,143 | 1,222,747 | 1,638,720 |
| FY2025 | 405,724 | 852,428 | 1,318,378 | 1,774,231 |
* Hyperinflation accounting has been applied to the Turkish subsidiary since Q2 FY2022. Figures from FY2022 onward reflect this application.
《Operating Profit》
Since 2020, operating profit has increased for five consecutive years in proportion to revenue growth. In FY2025, although goodwill impairment losses were recognized following impairment testing of the Cromology Group to reflect the latest business environment amid deteriorating market conditions in Europe, operating profit reached a record high due to higher revenue, improvements in raw material cost ratios and SG&A expense ratios, and gains on the sale of fixed assets at the Tokyo site.
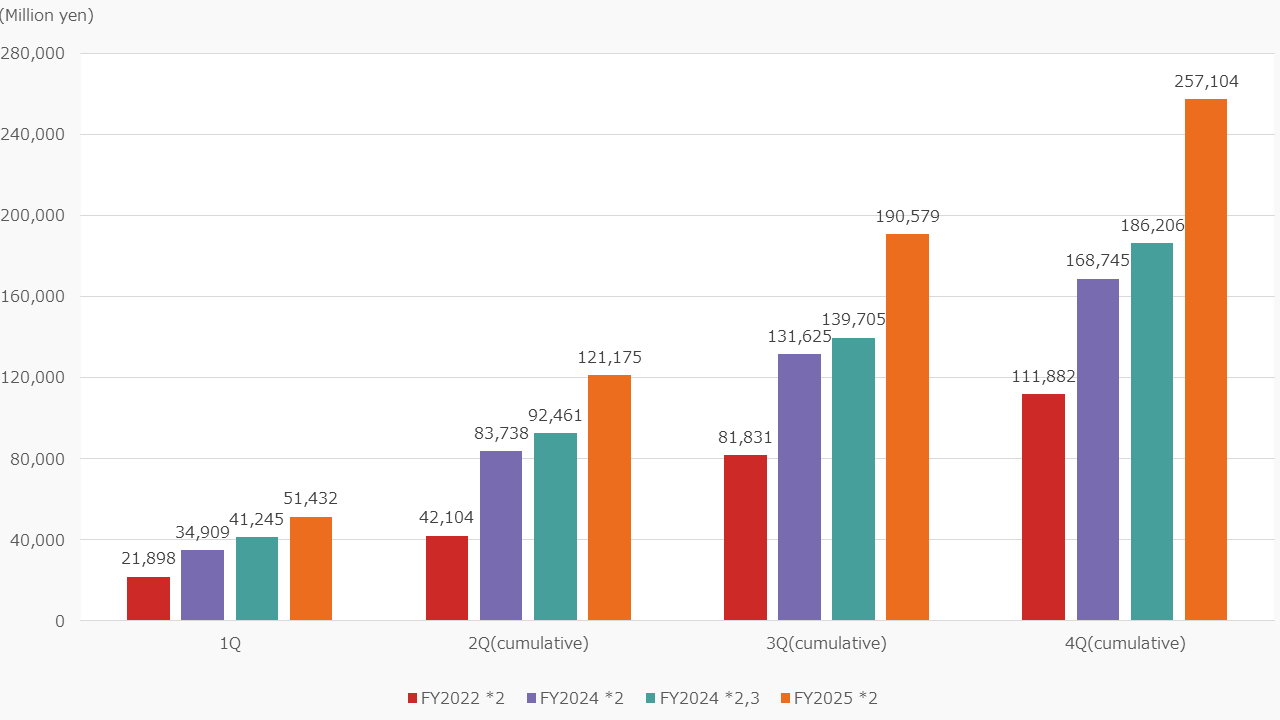
(Unit: ¥ million)
|
|
1Q | 2Q (Cumulative) | 3Q (Cumulative) | Full Year |
|---|---|---|---|---|
| FY2022 | 21,898 | 42,104 | 81,831 | 111,882 |
| FY2023 | 34,909 | 83,738 | 131,625 | 168,745 |
| FY2024 | 41,245 | 92,461 | 139,705 | 186,206 |
| FY2025 | 51,432 | 121,175 | 190,579 | 257,104 |
* Hyperinflation accounting has been applied to the Turkish subsidiary since Q2 FY2022. Figures from FY2022 onward reflect this application.
* Retrospective adjustments were made for FY2022 following the finalization of PPA for Cromology and JUB.
* Retrospective adjustments were made for FY2024 following the finalization of PPA for Alina, NPI, and BNPA.
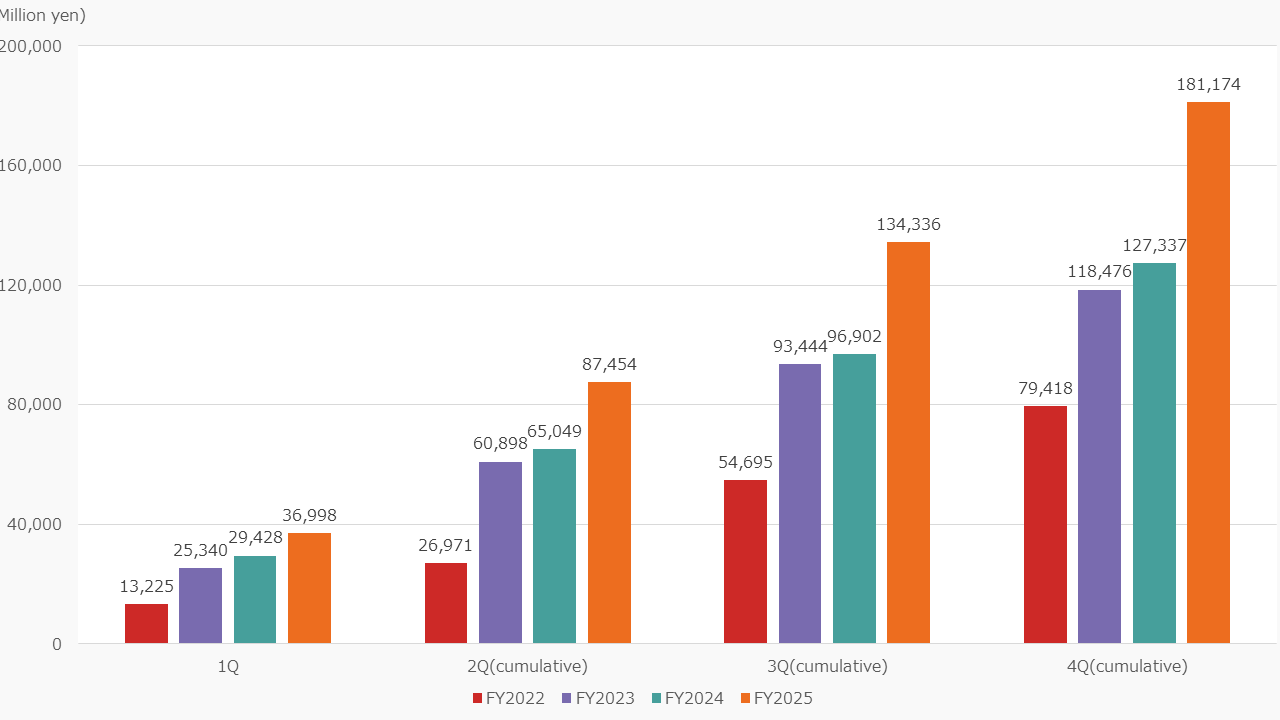
《Profit Attributable to Owners of the Parent》
Profit attributable to owners of the parent has generally moved in line with trends in operating profit and other profit indicators. Since FY2021, it has increased for five consecutive years, reflecting earnings growth associated with higher revenue.
(Unit: ¥ million)
|
|
1Q | 2Q (Cumulative) | 3Q (Cumulative) | Full Year |
|---|---|---|---|---|
| FY2022 | 13,225 | 26,971 | 54,695 | 79,418 |
| FY2023 | 25,340 | 60,898 | 93,444 | 118,476 |
| FY2024 | 29,428 | 65,049 | 96,902 | 125,890 |
| FY2025 | 36,998 | 87,454 | 134,336 | 181,174 |
* Hyperinflation accounting has been applied to the Turkish subsidiary since Q2 FY2022. Figures from FY2022 onward reflect this application.
* Retrospective adjustments were made for FY2022 following the finalization of PPA for Cromology and JUB.
* Retrospective adjustments were made for FY2024 following the finalization of PPA for Alina, NPI, and BNPA.