2020
6.6%

Our basic Management Policy, Management Strategy, Medium-Term Management Plan, and competitive strengths

Driving EPS Compounding Through
Our Finance Strategy
Yuichiro Wakatsuki
Director, Representative Executive
Officer & Co-President
We place great emphasis on our ability to compound sustainable EPS. Accordingly, we will direct cash generated towards M&A activities to ensure future growth, thereby delivering value to our shareholders.
While w maintain detailed KPIs at each asset level, our approach as Asset Assembler dictates that we refrain from setting uniform margin and CCC targets that disregard the individual circumstances of local operations. The management teams of our partner companies are steadfast in their commitment to improving operations while ensuring sustained growth. We strongly believe that the combined strength of our Group, forged through the collaboration of these partners, transcends the pursuit of standardized indicators.
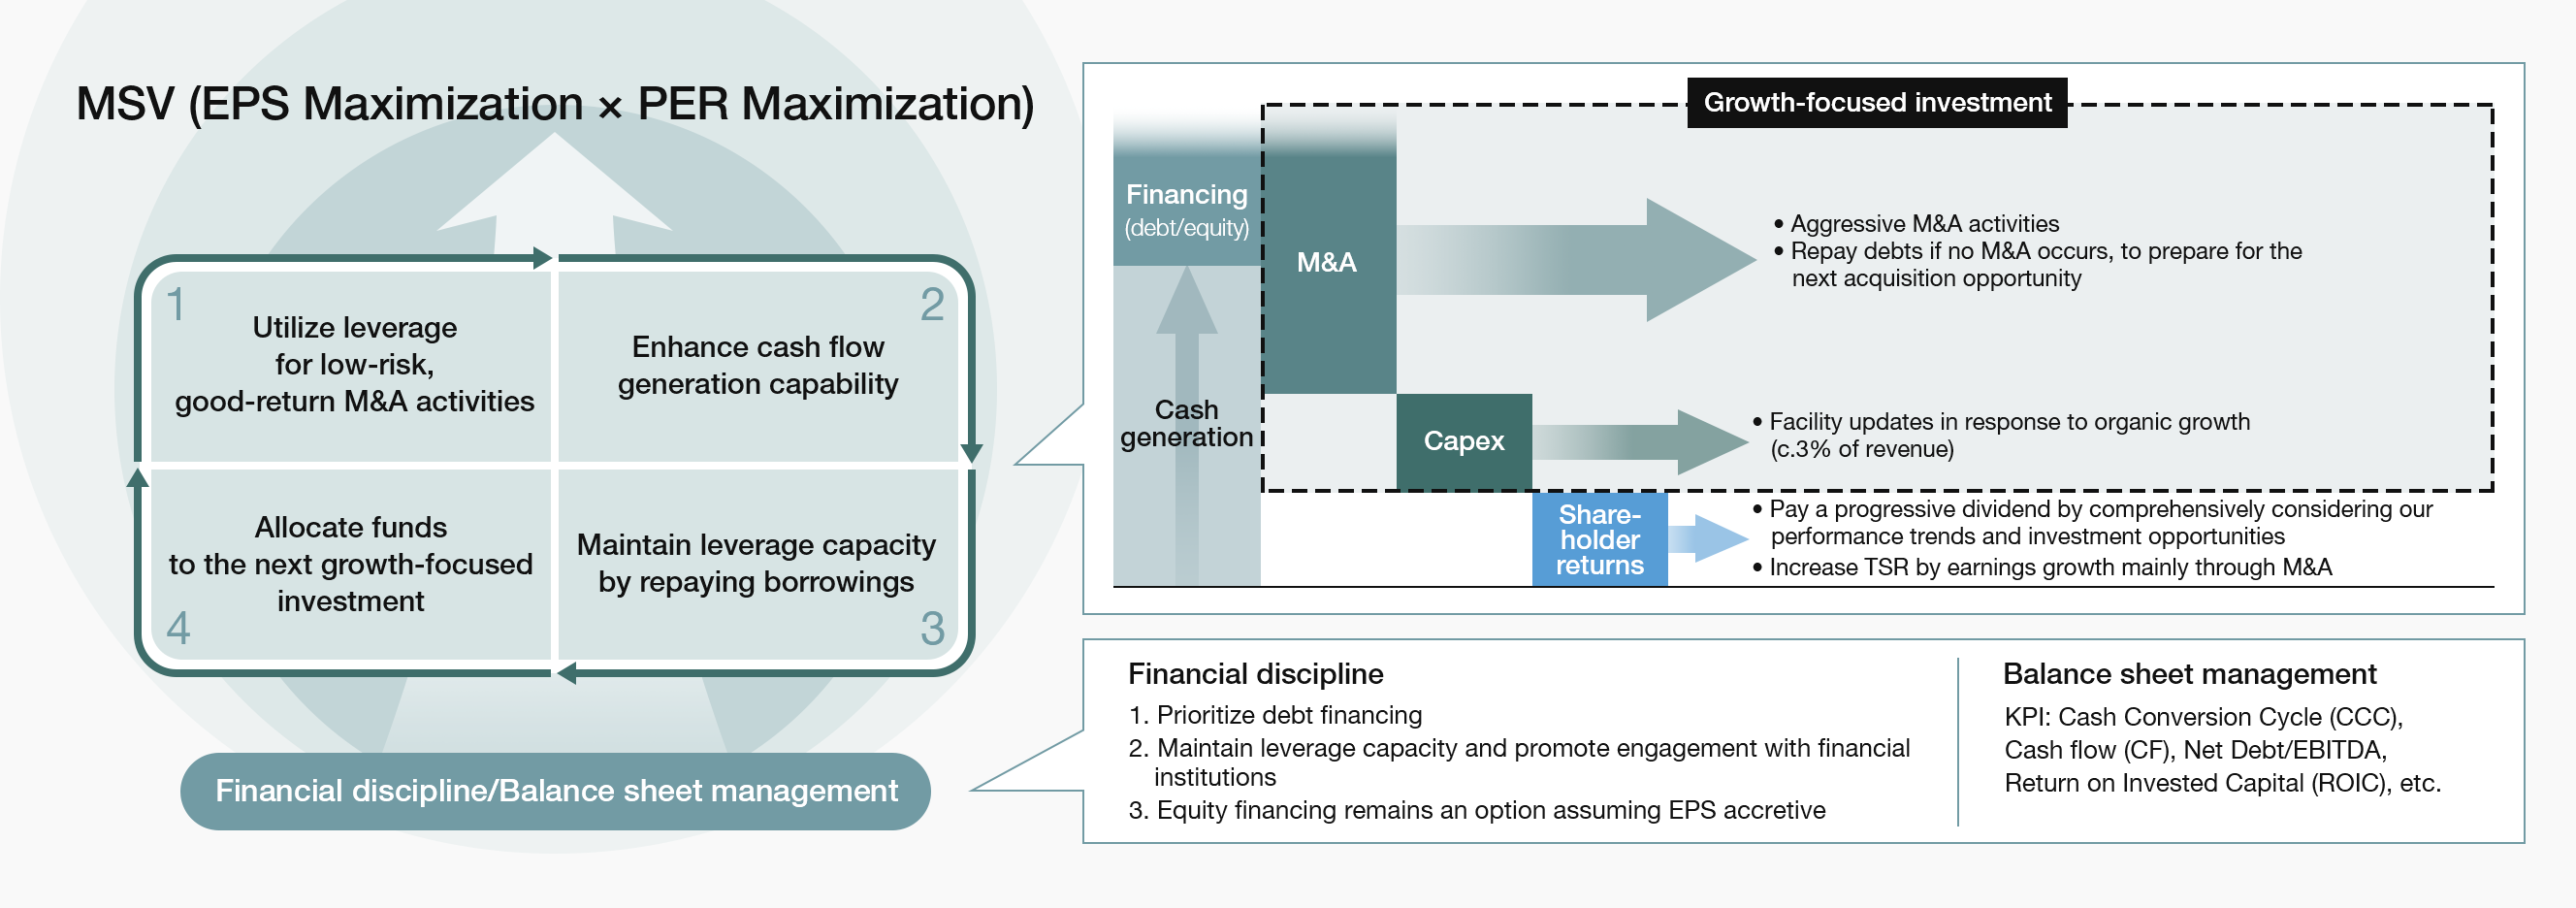
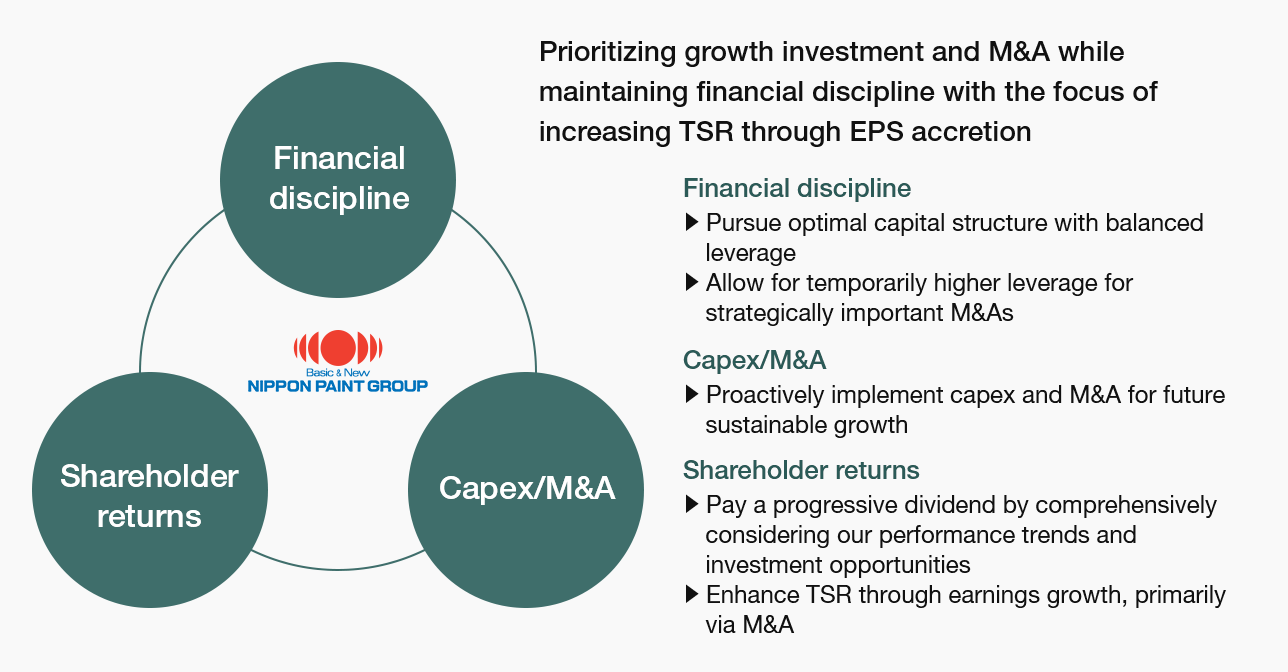
Our capital policy prioritizes growth-oriented investments while maintaining financial discipline, with the primary objective of sustainable and long-term maximization of EPS, ultimately leading to the maximization of PER.
Our financial discipline focuses on prioritizing debt financing while preserving leverage capacity to maintain access to low-cost funding. Recognizing the crucial importance of fostering a clear understanding of our Company’s risk profile among financial institutions and rating agencies, we are facilitating active dialogue with these entities and enhancing our disclosure materials.
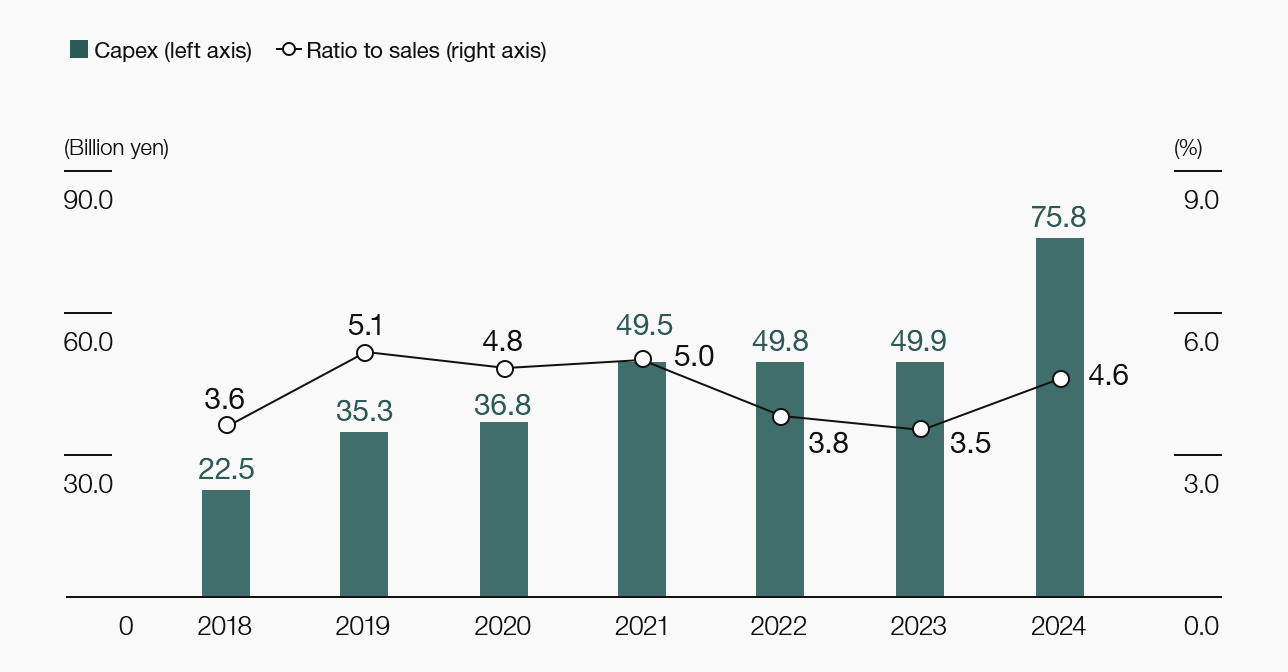
We deploy capital expenditures aimed at securing future sustainable growth noting the burden of capital investment is relatively small, accounting for only around 3% of revenue, mostly in maintenance capex. We maintain a disciplined approach to new investment initiatives aimed at enhancing production capacity, reinforcing digital transformation (DX), and advancing research and development across all regions and business segments. Consequently, M&A remains our most capital-intensive investment. In line with our Asset Assembler model, we will continue to focus on accumulating highquality, low-risk M&A at reasonable valuation
Regarding dividends, we currently follow a progressive dividend policy, whereby dividends will be maintained or increased with no reductions as a general principle, taking into comprehensive consideration our performance trends and investment opportunities. With significant EPS growth anticipated from the AOC acquisition, we are prioritizing debt repayment to prepare for future acquisition opportunities that can contribute to EPS, rather than adhering to our previous target payout ratio of 30%. Share buybacks remain an option; however, we objectively assess the relative contribution to MSV by comparing investment in our own shares with investments in potential M&A candidates. Given the abundance of attractive investment opportunities currently available, the appeal of share buybacks is lower, hence no buyback was implemented last year. (For information about the trends in dividends and TSR, see “Financial Highlights.”)
In terms of balance sheet management, we have established CCC as one of the key performance indicators. Each partner company is working to shorten CCC by reviewing transaction terms within each region and business segment. While our CCC in 2024 reflects a rebound following significant improvement in NIPSEA China’s CCC in 2023, we have continued to see a steady historical improvement, particularly in Japan and Asia. Our fixed assets (tangible and intangible assets, goodwill) have been increasing primarily due to M&A activities, and we proactively monitor these assets with an emphasis on efficiency and profitability. Regarding goodwill, we strive to minimize impairment risks by selecting cash-generating target businesses, ensuring smooth post-merger integration (PMI) through our autonomous and decentralized management approach, and consistently pursuing high-quality M&A at reasonable valuations.
As of December 31, 2024
“Cash and equivalents”
“Trade and other receivables”
“Other financial assets (non-current assets)”
“Property, plant and equipment”
“Goodwill” and “Other intangible assets”
“Bonds and loans payable”
(Interest-bearing debts)
“Capital”
“Retained earnings”
We have maintained strong cash generation capabilities, and our asset portfolio consists entirely of partner companies that are fundamentally capable of autonomous growth and stable cash generation. In terms of financial leverage, strong cash generation driven by revenue growth in 2024 brought our net debt/EBITDA ratio down to 1.9 times at year-end. Although this ratio is expected to rise to 3.0-3.2 times at the end of 2025 due to the acquisition of AOC, we anticipate it will return to 2.2-2.4 times by end of 2026, roughly in line with the level at the end of 2023, prior to the AOC acquisition. Our financial soundness remains robust, even compared to the track record of our competitors. Moving forward, while retaining ample debt capacity to seize new opportunities, we will strive for an optimal capital structure and work towards fostering trust and creditworthiness with financial institutions and rating agencies. (For trends in ratings, please refer to the “Bonds and Ratings” section on our website.)
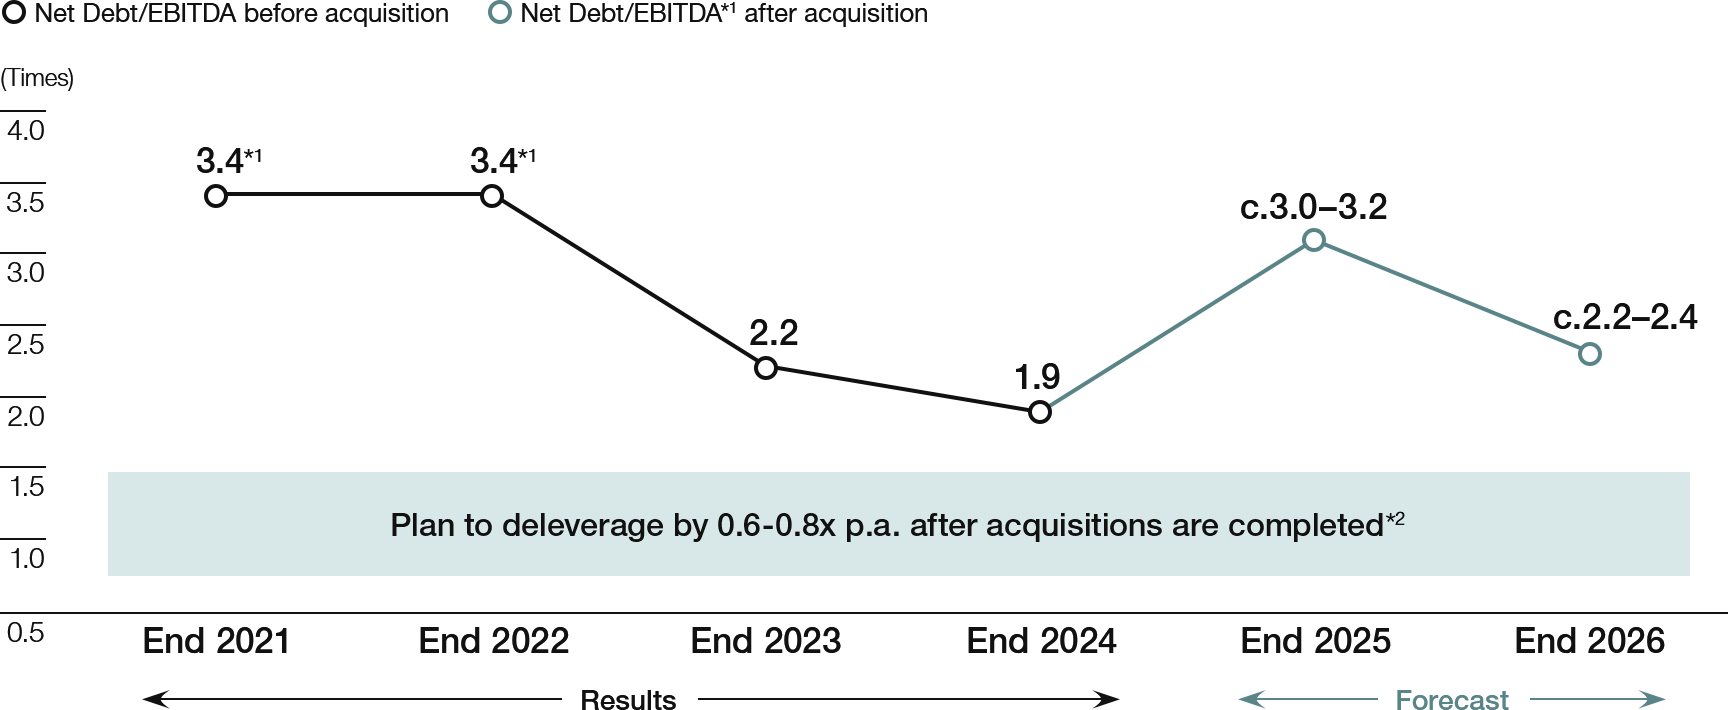
*1 Excluding one-off items
*2 Assuming no additional acquisitions
In 2024, our consolidated Return on Invested Capital (ROIC) was 7.3%, representing a slight improvement over the previous year (see Figure A). This improvement was primarily attributed to (1) an improvement in ROIC due to limited increment in goodwill absent large-scale M&A activities in 2024, and (2) higher after-tax operating profit driven by business growth. Our Weighted Average Cost of Capital (WACC) is estimated to be around 5-6%.
Over the past five years, while EPS has steadily increased, ROIC has remained static in the range of 5-7%. This stability is largely due to the recognition of goodwill associated with our active M&A activities. We consider this to be inevitable for a company that places M&A as a pillar of its growth strategy. Furthermore, invested capital has increased annually, and after-tax operating profit has risen steadily over the five years through 2024.
* ROIC: After-tax operating profit/(Net Debt + Total equity)
* A uniform effective tax rate of 24% is applied to each year, based on the average consolidated effective tax rate for prior years
* Invested capital = Net debt + Equity (including ownership of non-controlling shareholders)
* Net debt = “Bonds and borrowings” + “Total other financial liabilities (current and non-current)” – “Cash and cash equivalents” – “Other financial assets (current)”
Our strength as an Asset Assembler lies in our ability to consistently make safe acquisitions. While our goal is to maximize long-term and sustainable EPS through these acquisitions, we believe that a strategy overly focused on improving ROIC does not optimally utilize our platform nor align with our overall strategy. I would like to emphasize that the companies we acquire (1) operate their businesses with high capital efficiency relative to the invested capital, such as working capital and capital expenditure, and (2) generally present low business risks and high safety due to their stable business models, strong brand power, and quality management teams.
Since we are allocating capital entrusted to us by investors for acquisitions, our standard procedure is to examine the respective ROIC of each acquisition. Our goal is to achieve an ROIC that surpasses the assumed WACC within a few years post-acquisition. Indeed, the major five companies we acquired since 2019 have either already seen their ROIC exceed the WACC or are on a steady path towards this goal, with all demonstrating year-on-year improvements in their ROIC.
There is a common perception that companies actively engaged in M&A carry significant risk. However, a unique characteristic of our business is its high efficiency: we generate cash and profits locally, and our capex requirements are relatively low. As we consistently acquire such safe companies, our Group, even with the inclusion of goodwill in our consolidated accounts, can be confidently described as a collection of very low-risk assets.
During our dialogues with investors, some have expressed a desire for double-digit expected growth rates. We note that our business domain generates substantial cash flow that can be deployed towards share buybacks, rather than undertaking M&A, which will consistently improve ROIC. Indeed high-ROIC paint manufacturers can demonstrate a scenario of achieving double-digit growth through a combination of single-digit organic EPS growth and share buybacks.
On the other hand, as outlined in our Medium-Term Strategy, we already have the potential for double-digit growth, with a medium-term consolidated CAGR target of 10-12% organic growth in EPS without any share buybacks. The substantial cash flow generated is primarily allocated towards M&A that contribute to the maximization of long-term EPS. We aim for exceptional growth with 10-12% organic EPS growth, plus additional upside through M&A contributing to EPS from Year 1 post-acquisition.
Based on this strategy, our approach to returns is twofold: (1) to expand the basis of EPS growth through M&A rather than focusing on short-term shareholder returns, and (2) to reserve cash flows as dry powder (standby funds) for future M&A, even if this reduces leverage in the short term.
Within our Asset Assembler model, we do not set limitations on the business areas, regions, or scale of our M&A targets as long as they are low-risk and offer good returns. Given the abundance of safe targets that contribute to EPS, we believe our policy and strategy are justifiable. As we naturally consider ROIC as one of the key indicators, we are dedicated to achieving organic profit growth and shortening Cash Conversion Cycle (CCC). However, we believe it is not appropriate to rely solely on consolidated ROIC to evaluate the potential of our Company.
* ROIC after-tax operating profit (after PPA amortization of intangible assets) / acquisition cost (excluding goodwill but including transfer consideration and subsequent capital increase, etc.), converted into Japanese yen using actual exchange rates
* The ROIC calculation for DGL (Pacific), Betek Boya, and JUB excludes Year 1 as these companies were acquired during the fiscal year
* None of these companies incurred any acquisition-related costs in Year 1
* Until 2023, the DuluxGroup figures represented the consolidated total excluding Cromology and JUB. For 2024, the figure represents DGL (Pacific) only, with DGL (Europe) excluded from the consolidated total
* For Betek Boya, the statutory tax rate for 2024 is applied to each fiscal year, due to abnormal tax rates resulting from the application of hyperinflationary accounting. For other companies, the average statutory effective tax rate for prior years is applied to each year
Record-high performance driven by organic growth and M&A
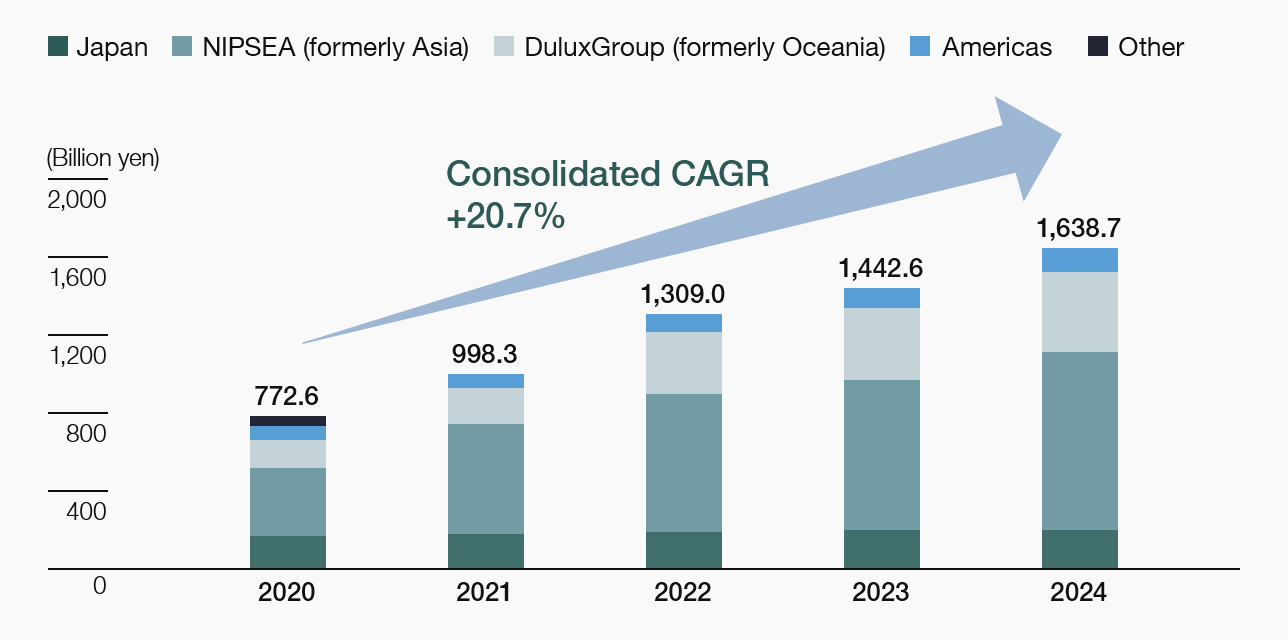
Revenue growth accelerated through active M&A and organic growth.
In 2024, revenue rose for the eighth consecutive year to a record high, driven by new consolidations, higher sales volumes mainly in the decorative segment, growth in adjacencies, and yen depreciation.
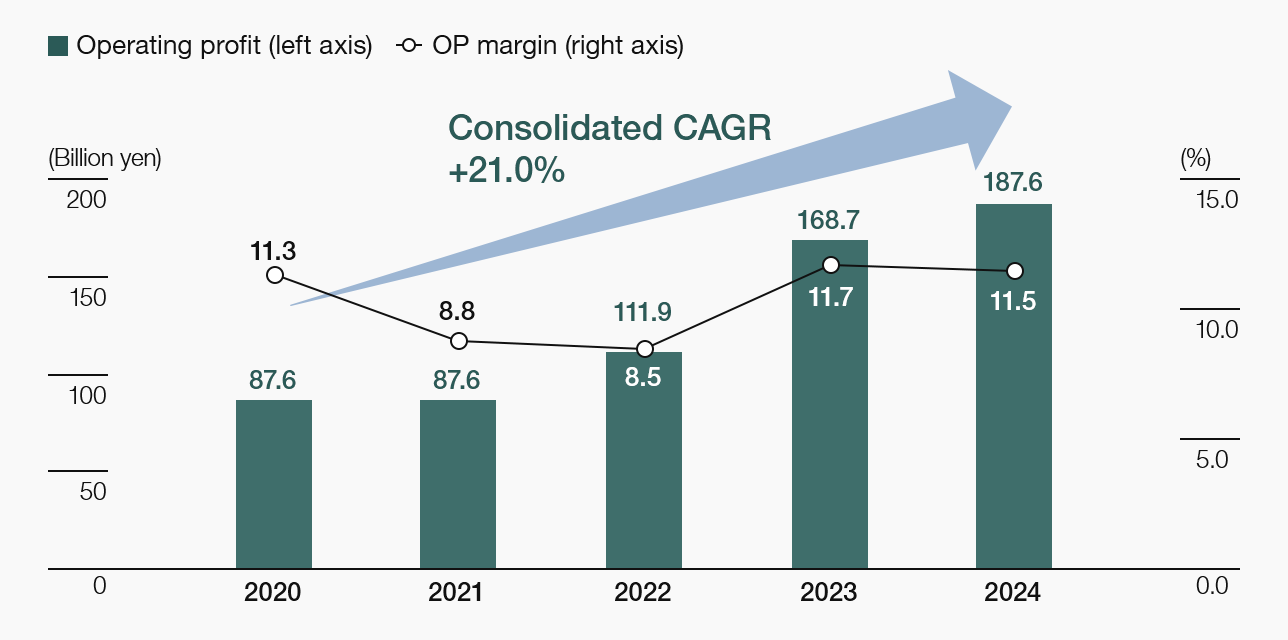
Record high achieved through revenue growth and profitability improvement Despite a challenging market, operating profit has grown for five consecutive years, reaching a record high in 2024 on higher revenue and an improved gross profit margin. Our operating profit margin stayed in the 11% range for a second year.
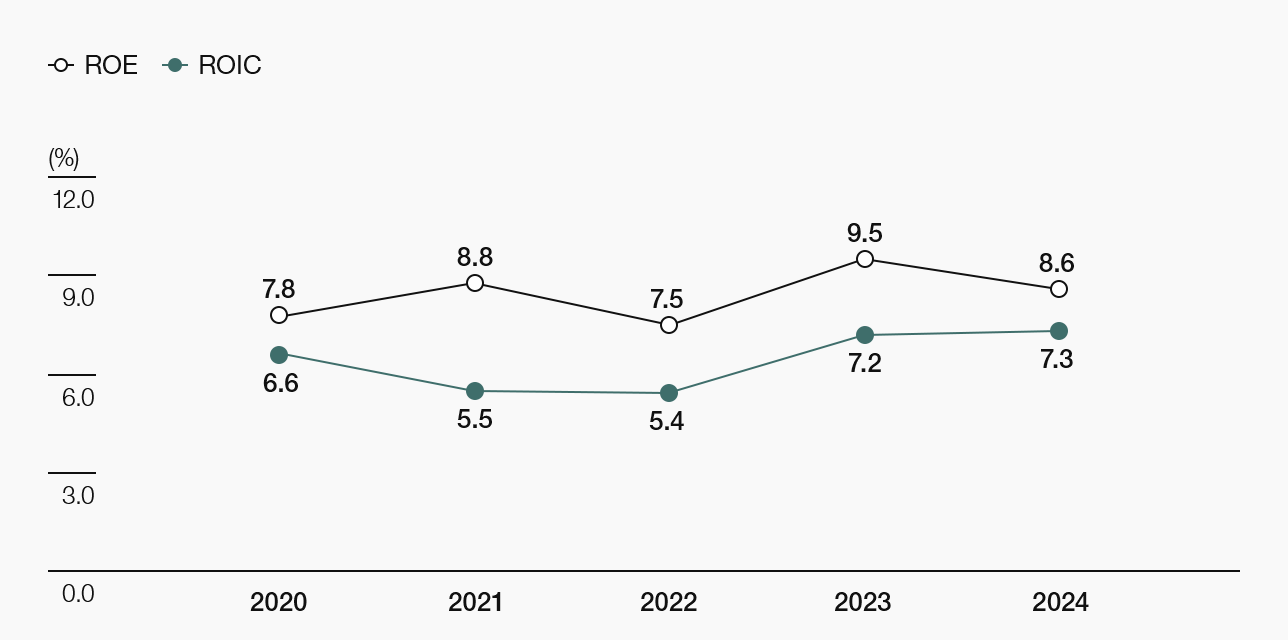
Balancing capital efficiency and EPS growth to expand economic value Since 2023, ROE has stayed at around 9%, reflecting higher net profit and margin improvements. ROIC has been significantly affected by goodwill from active M&A. In 2024, ROIC improved slightly year-on-year, reflecting both a higher invested capital turnover ratio and an increase in after-tax operating profit driven by business growth.
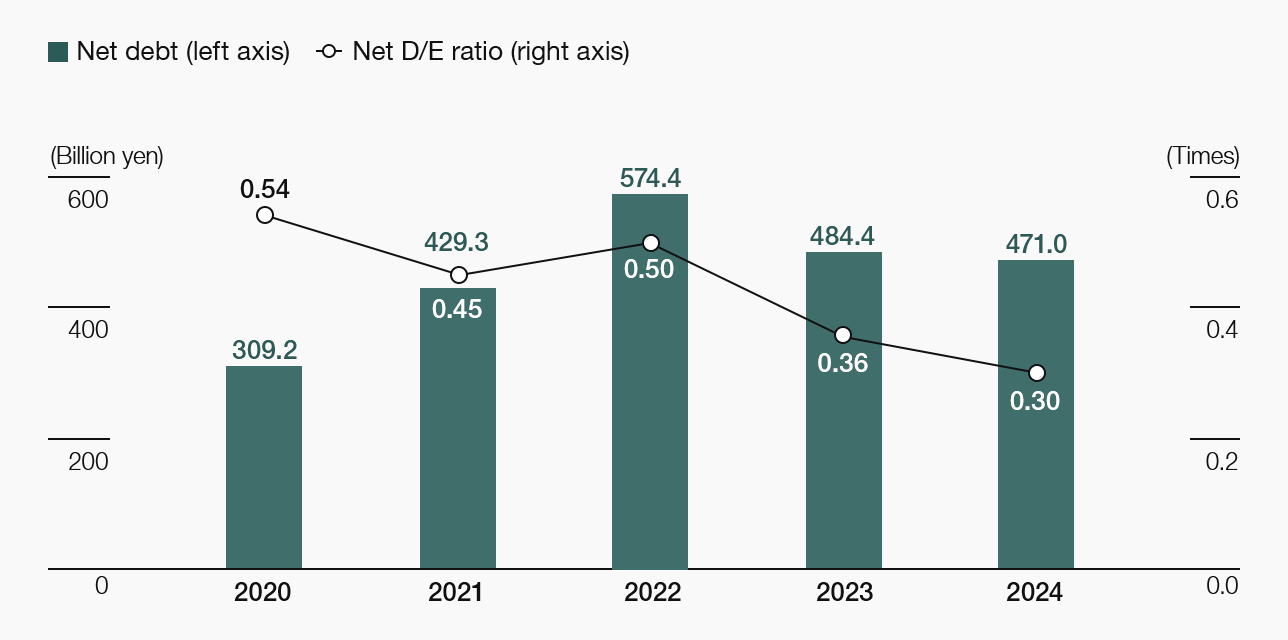
Debt financing associated with active M&A drove upward trend in net debt Our net debt is typically negative due to strong cash generation and low capex requirements, but has turned positive in recent years due to borrowings for M&A activity. The net D/E ratio declined through 2024, as no large-scale M&A occurred.
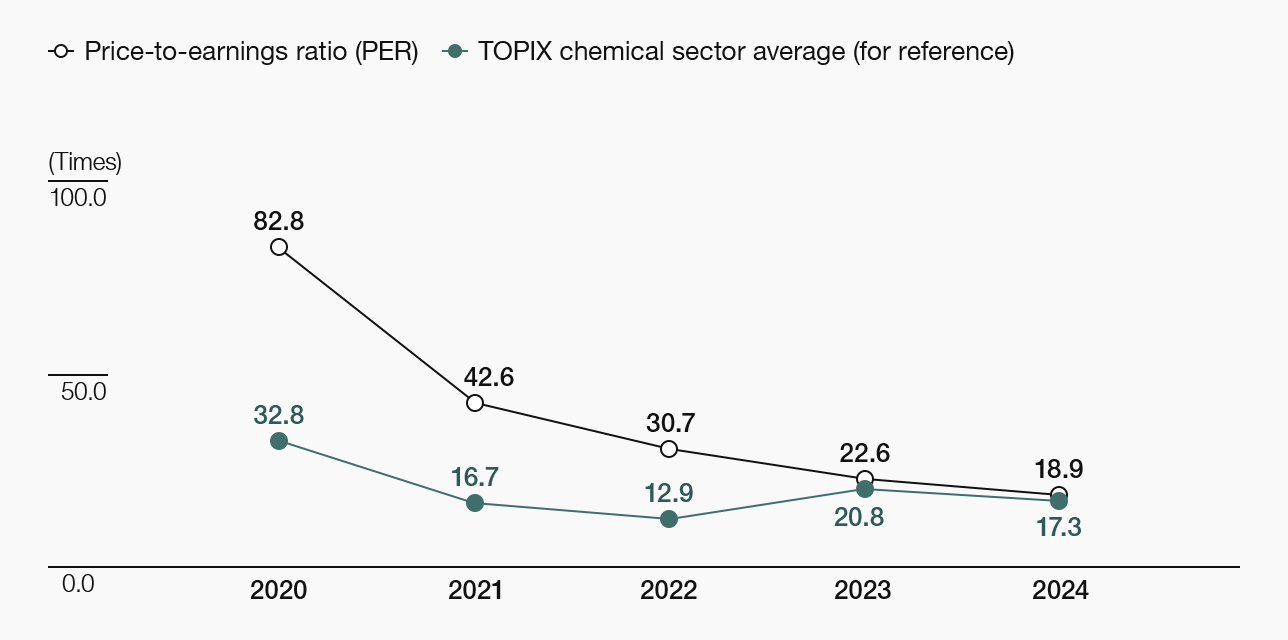
PER has consistently outperformed TOPIX chemical sector average PER rose sharply in 2020 reflecting investors’ preference for growth stocks and our active M&A activities, among other factors, but has trended downward since 2021 due to factors including China-related market concerns.
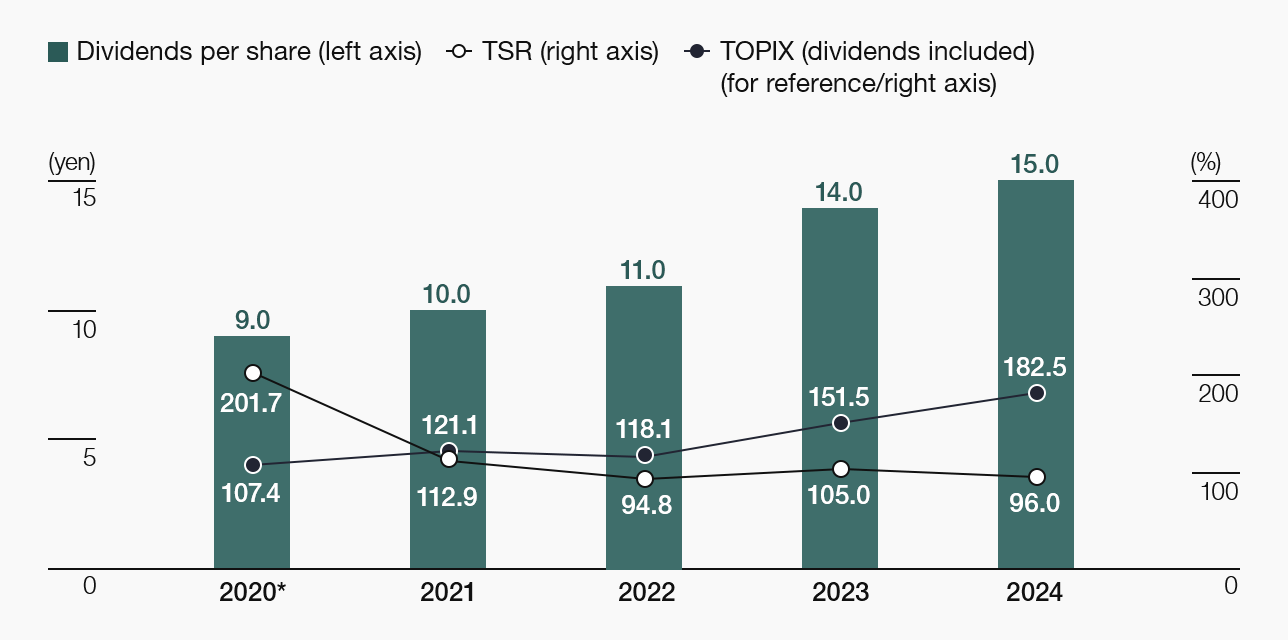
Four consecutive years of dividend increases; progressive dividend policy from 2025 Our policy is to provide stable and consistent dividends, which we have increased for four consecutive years through 2024. Since 2021, TSR has lagged TOPIX (dividends included) due to China-related market concerns and other factors.