Our Strategy for Maximizing PER
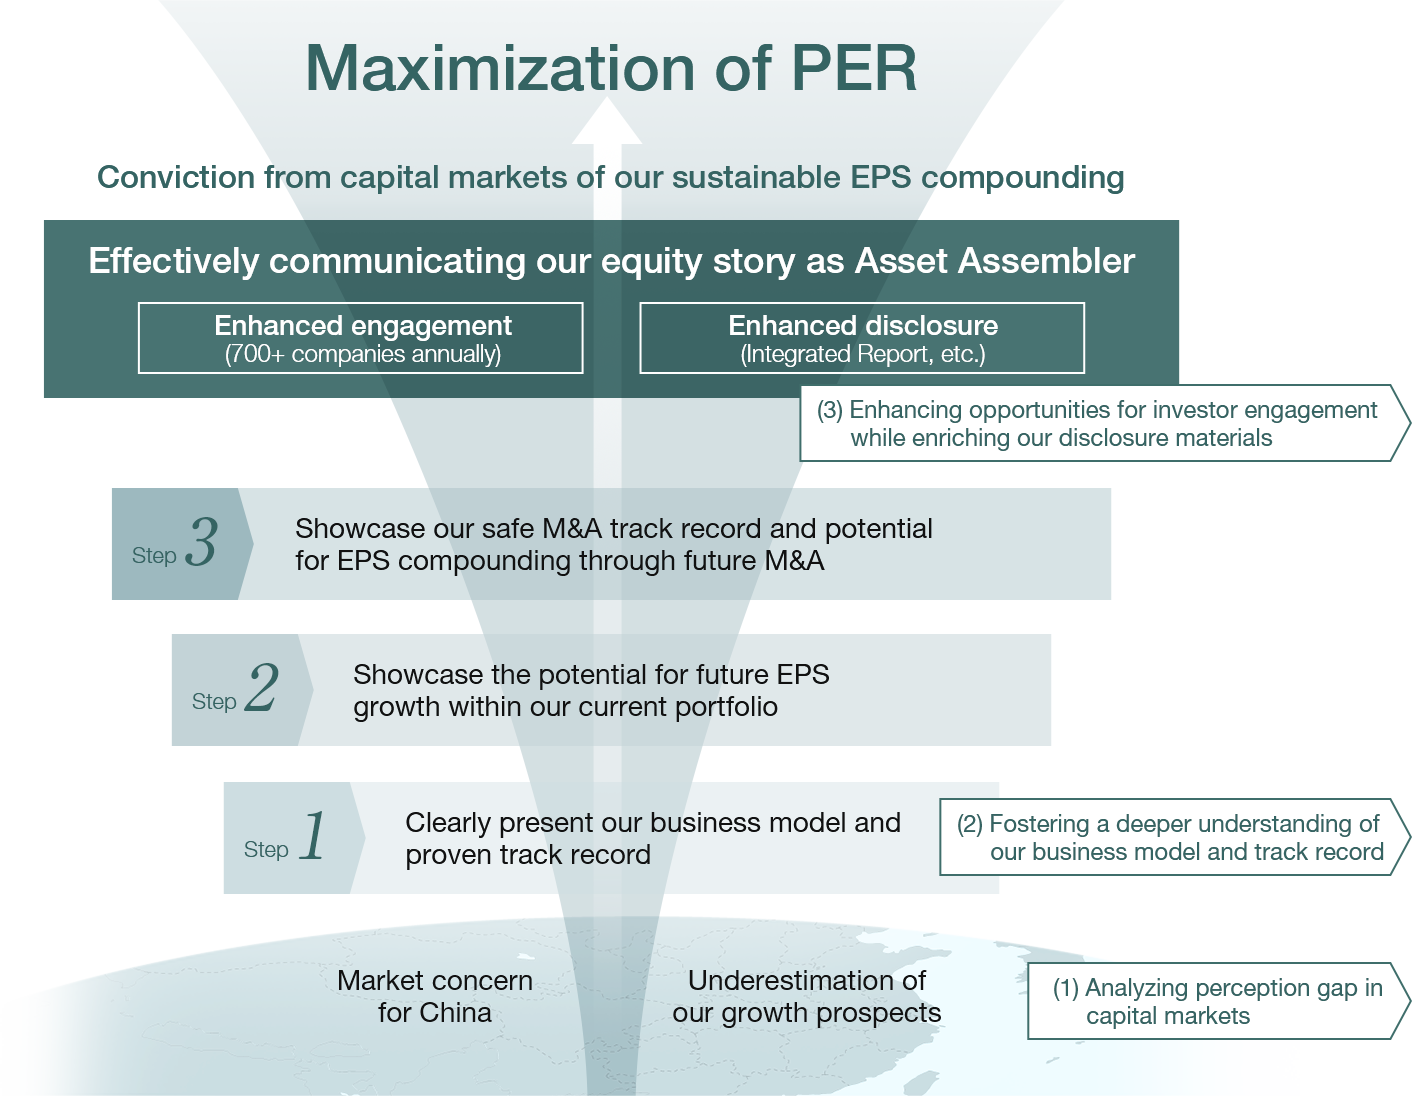
We are dedicated to sustainable EPS compounding, aiming to raise capital market expectations in our pursuit of maximizing PER. Our detailed plans of action are: (1) analyzing perception gap in capital markets, (2) fostering a deeper understanding of our business model and track record, and (3) enhancing opportunities for investor engagement while enriching our disclosure materials.

Analyzing Perception Gap in Capital Markets
(i) Our stock price analysis (in comparison with the TOPIX chemical sector average and the average of our competitors)
- Over the past five years, our stock price has outperformed the average of our competitors, backed by strong EPS growth.
- From 2021 to 2022, our stock price was impacted by the decline in PER.
(ii) Performance analysis of our China business (in comparison with Chinese macroeconomic indicators)
- Revenue from our TUC segment has historically outpaced the growth rate of commercial and residential property sales areas. We observe a low correlation between our TUC revenue and macroeconomic indicators.
- Revenue from our TUB segment has historically grown faster than the rate of growth of new construction starts.
- In comparison to our local competitors, our Group’s dependence on the Chinese market is lower, and our margins are higher.
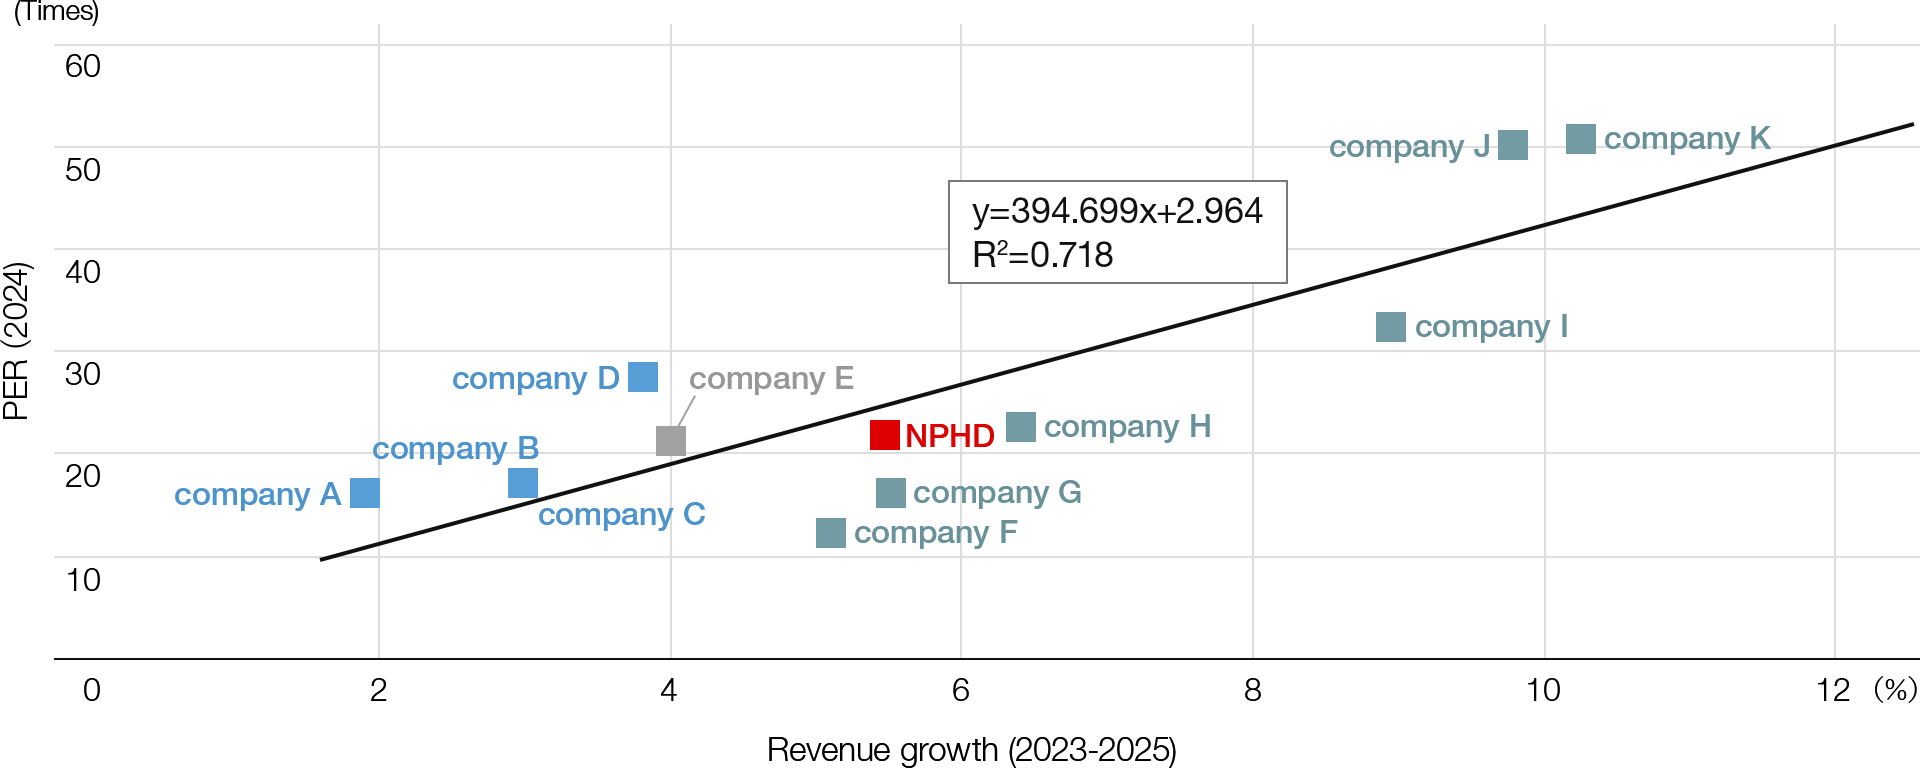
(iii) Correlation analysis between PER and revenue growth in the paint industry
- An analysis of “PER for 2024” and the “average revenue growth forecast from 2023-2025” (both based on analysts’ consensus estimates) within the paint industry reveals a determination coefficient (R2) of 0.718, indicating a strong correlation between these two factors.
- In our Medium-Term Strategy, we projected a medium-term consolidated CAGR of 8-9% for our revenue based on our 2023 portfolio, which includes our Kazakhstan operations and the two India businesses. However, analysts’ forecasts (as shown in the chart below) forecast a lower growth rate for our revenue at 5.5%, placing us below the regression line. Considering our aggressive M&A strategy, we analyze that this growth estimation may not be capturing our growth potential.
Correlation analysis of PER and revenue growth

Source: FactSet (as of February 9, 2024), Wall Street Research; The correlation factor was calculated by excluding Chinese companies
Our Initiatives for Raising Capital Market Expectations

Fostering a deeper understanding of our business model and track record
-
(i) Our approach, business model, and track record
- Sustainable compounding of EPS, driven by both organic and inorganic growth
- Synergistic effects created from the advantage of our Asset Assembler model
-
(ii) Growth potential within our existing portfolio
- Target a medium-term consolidated CAGR of 10-12% for our EPS
- Expand our market share and EPS across all regions and businesses
-
(iii) Proven record of successfully executing safe M&As and assurance of future growth potential
- Demonstrate a stable growth track record of our acquired companies and improvement in individual ROIC
- Our unique M&A model, which assumes EPS accretion from Year 1, even with large-scale acquisitions, paves the way for limitless enhancement in EPS.
Enhancing opportunities for investor engagement while enriching our disclosure materials
-
(i) Enhancing opportunities for investor engagement
- Increase our meetings with investors, particularly targeting those in the US and Europe, new investors, and global investment funds
- Actively participate in conferences hosted both in Japan and overseas
-
(ii) Enriching our disclosure materials
- Integrated Report provides detailed explanations on key topics of interest, such as our Asset Assembler model and our commitment to protecting minority shareholder interests.
- IR website presents case studies that highlight our innovations and human resource strategy, and explains the results of our cross-functional collaborations within the Group.
-
(iii) Expanding IR events
- Considering launching the “IR Day,” which will serve as an extension of the “Small Investor Meeting with Co-Presidents” and “Small Investor Meeting with Board Chair” that we have traditionally held
- Continue to hold the Medium-Term Strategy briefing and M&A briefing
KPIs of IR activities (2022-2023)
| 2022 | 2023 | |
|---|---|---|
| Number of IR meetings held (companies) | 695 | 707 |
| (Overseas investors) | 384 | 397 |
| (New investors) | 118 | 82 |
| (Meetings hosted by Co-President) | 108 | 87 |
| (Roadshows for international secondary offering) | 121 | - |
| Liquidity to market capitalization ratio | 0.18% | 0.17% |
| Analyst coverage (companies) | 7 | 6 |
IR activity plan (2024)
| 1st quarter | 2nd quarter | 3rd quarter | 4th quarter | |
|---|---|---|---|---|
| Quarterly results announcement |
|
|
|
|
| Integrated Report |
|
|
||
| Domestic investor conferences |
|
|
|
|
| International investor conferences |
|
|
||
| IR events |
|
|
|


