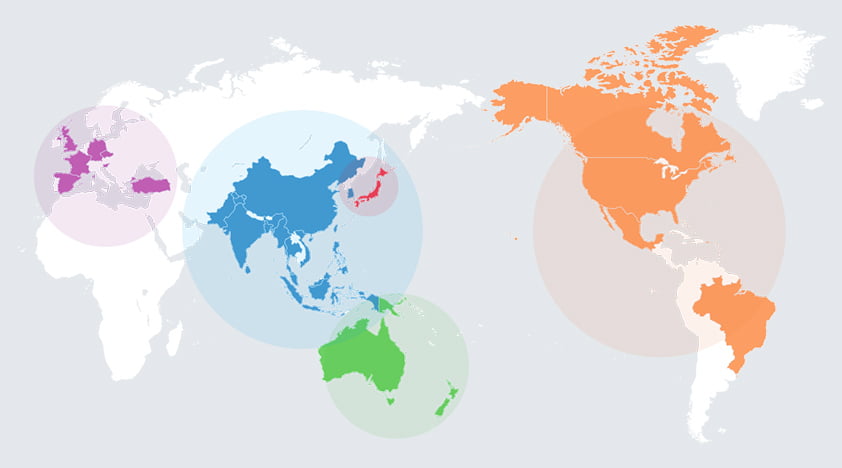
Features of the asset

DuluxGroup (Pacific・Europe)
  1. With a market presence in 22 countries across the Pacific*1 and Europe, commanding the No.1 market share in decorative paints in four countries, including Australia, and ranking in the top 3 in six other countries
  2. Anchoring its growth on three strategic pillars, being (1) extending its market leading position in the Pacific, (2) leveraging capability for growth into the mature European paint and coatings market, and (3) leveraging capability for growth into global SAF*2 segments
  3. Pursuing sustainable growth through organic growth and strategic M&As
  • Australia, New Zealand, Papua New Guinea
  • Sealants, Adhesives & Fillers

Competitive advantages

DGL (Pacific) Leading position and brand strength in the Pacific market
  • Maintaining and expanding industry-leading brand recognition and exceptional market share through continuous investments in innovation and marketing
    • Dulux’s unprompted brand recognition: c. 80% (almost double that of the second-ranked brand)
    • Various brands are consistently recognized as the most trusted in Australia
Growth capabilities leveraged by the Nippon Paint Group platform
  • Executes bolt-on acquisitions to complement sustained organic growth, leveraging NPHD’s strong financing capabilities
Creating growth opportunities through an autonomous and decentralized management approach
  • Proactively explores new growth initiatives and markets by leveraging a global platform of assets
DGL (Europe) Established a leading position in the European decorative market through M&A
  • Cromology is ranked No.4 in the European decorative market and JUB holds the leading position in Central Europe
Leveraging market expertise from the Pacific for growth in Europe
  • The European market shares similar consumer, customer, and competitive environment with the Pacific region, enabling DuluxGroup to drive growth by leveraging expertise developed in the Pacific market
Growth capabilities in the adjacencies market
  • Leveraging ETICS expertise developed by JUB and Betek Boya
  • Combining SAF expertise built through the Selleys brand with NPT’s supply chain and technological capabilities in the European SAF market

Financial outcomes

DuluxGroup (Consolidated)

2024 results

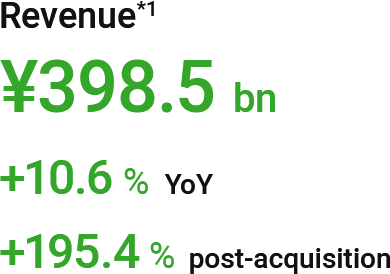
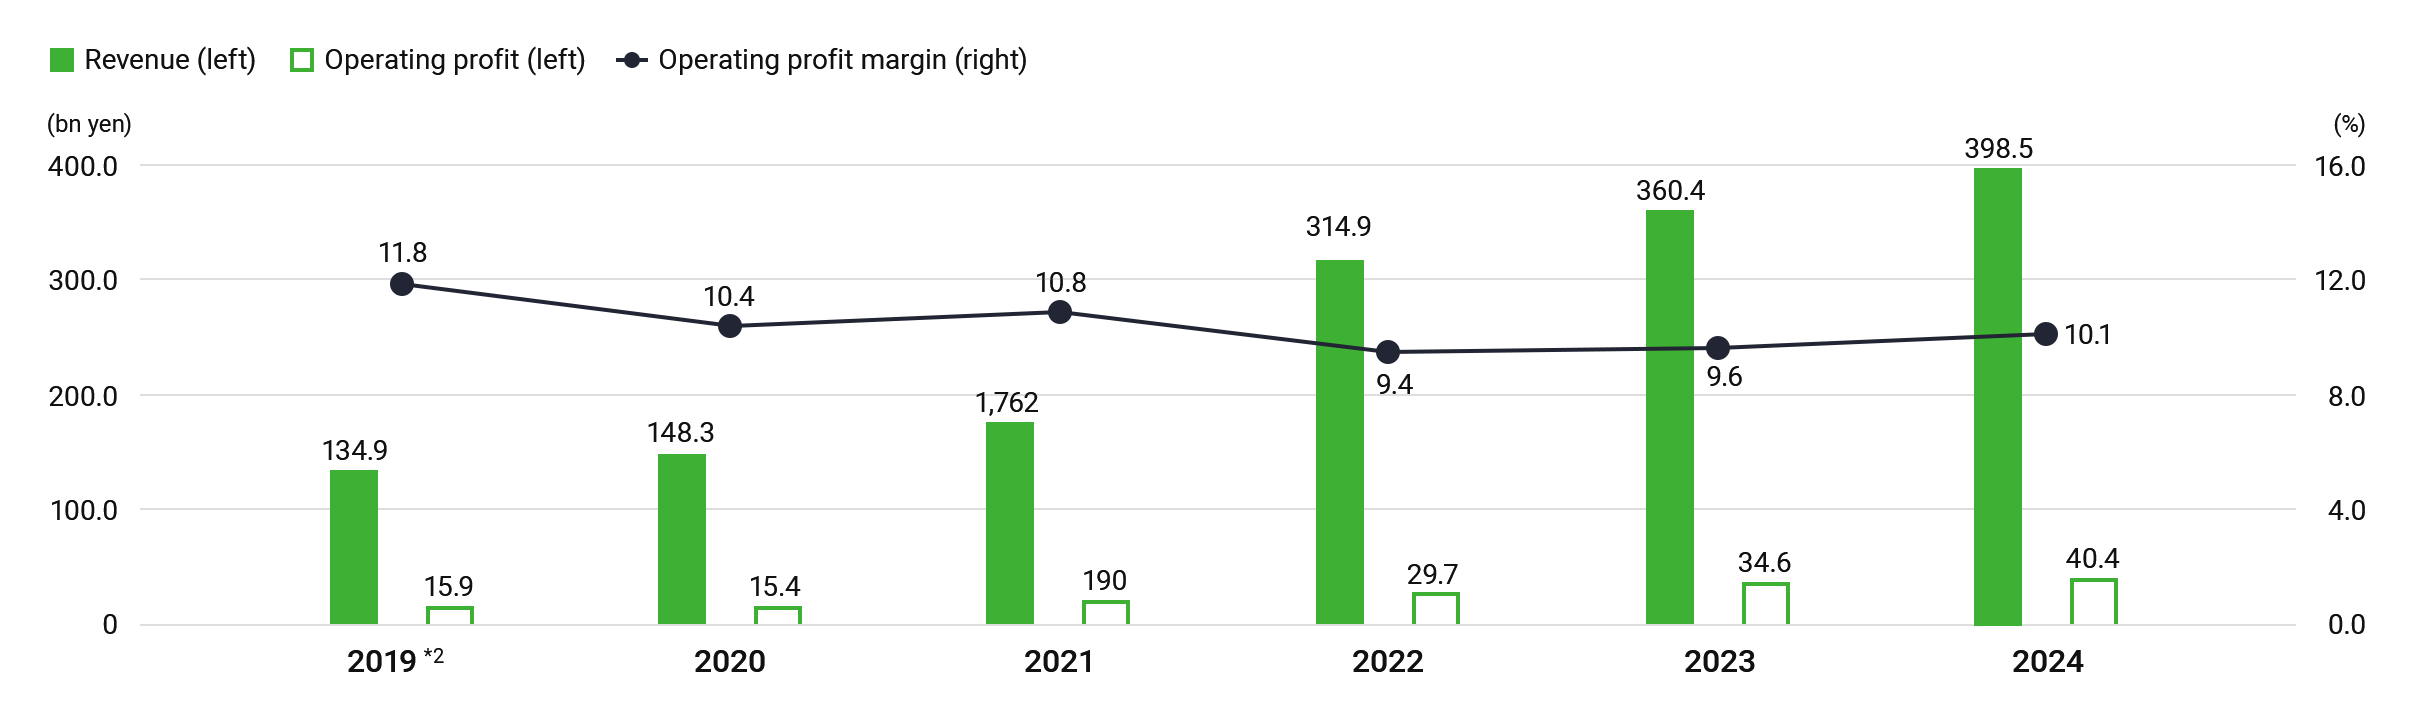
Revenue: In the decorative business, revenue increased year-on-year, despite sluggish sales volumes due to soft market conditions in the Pacific and Europe, partly driven by yen depreciation. In the adjacencies business, despite continued market weakness, revenue rose year-on-year, supported by business acquisitions in the Pacific region and the new consolidation of NPT. As a result, total revenue increased by 10.6% year-on-year to JPY 398.5 billion.
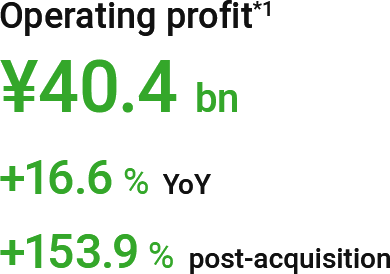
Operating profit: Despite higher SG&A expenses due to inflation, operating profit grew by 16.6% year-on-year to JPY 40.4 billion, supported by new consolidation, higher revenue, and an improved gross profit margin.

Growth since the acquisition (2019)

Under the guidance of its excellent management team, DuluxGroup has consistently achieved strong earnings growth through focus on organic and inorganic strategic growth initiatives across its three strategic pillars. DuluxGroup’s focus on strategic M&A has played an important role in complementing its organic growth initiatives, with over 30 acquisitions (including a mixture of strategic and small bolt-on businesses) executed since it joined Nippon Paint Group in 2019.
As a result, since the acquisition, revenue increased by 195.4% and operating profit rose by 153.9%.

Revenue(*1): ¥398.5 bn (+10.6% YoY, +195.4% post-acquisition)
Operating profit(*1): ¥40.4 bn (+16.6% YoY, +153.9% post-acquisition)

Trends in revenue, operating profit, and operating profit margin

Trends in revenue, operating profit, and operating profit margin
  • Segment basis (after elimination of inter-segment transactions and after PPA)
  • Pro forma figures. Including one-off items such as M&A cost

DGL (Pacific)

2024 results

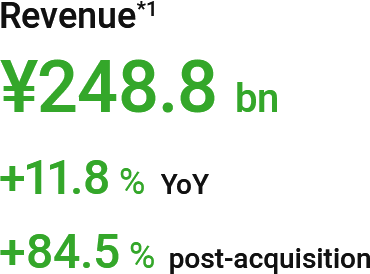
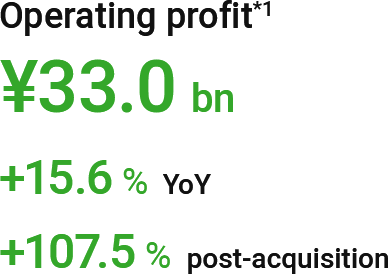
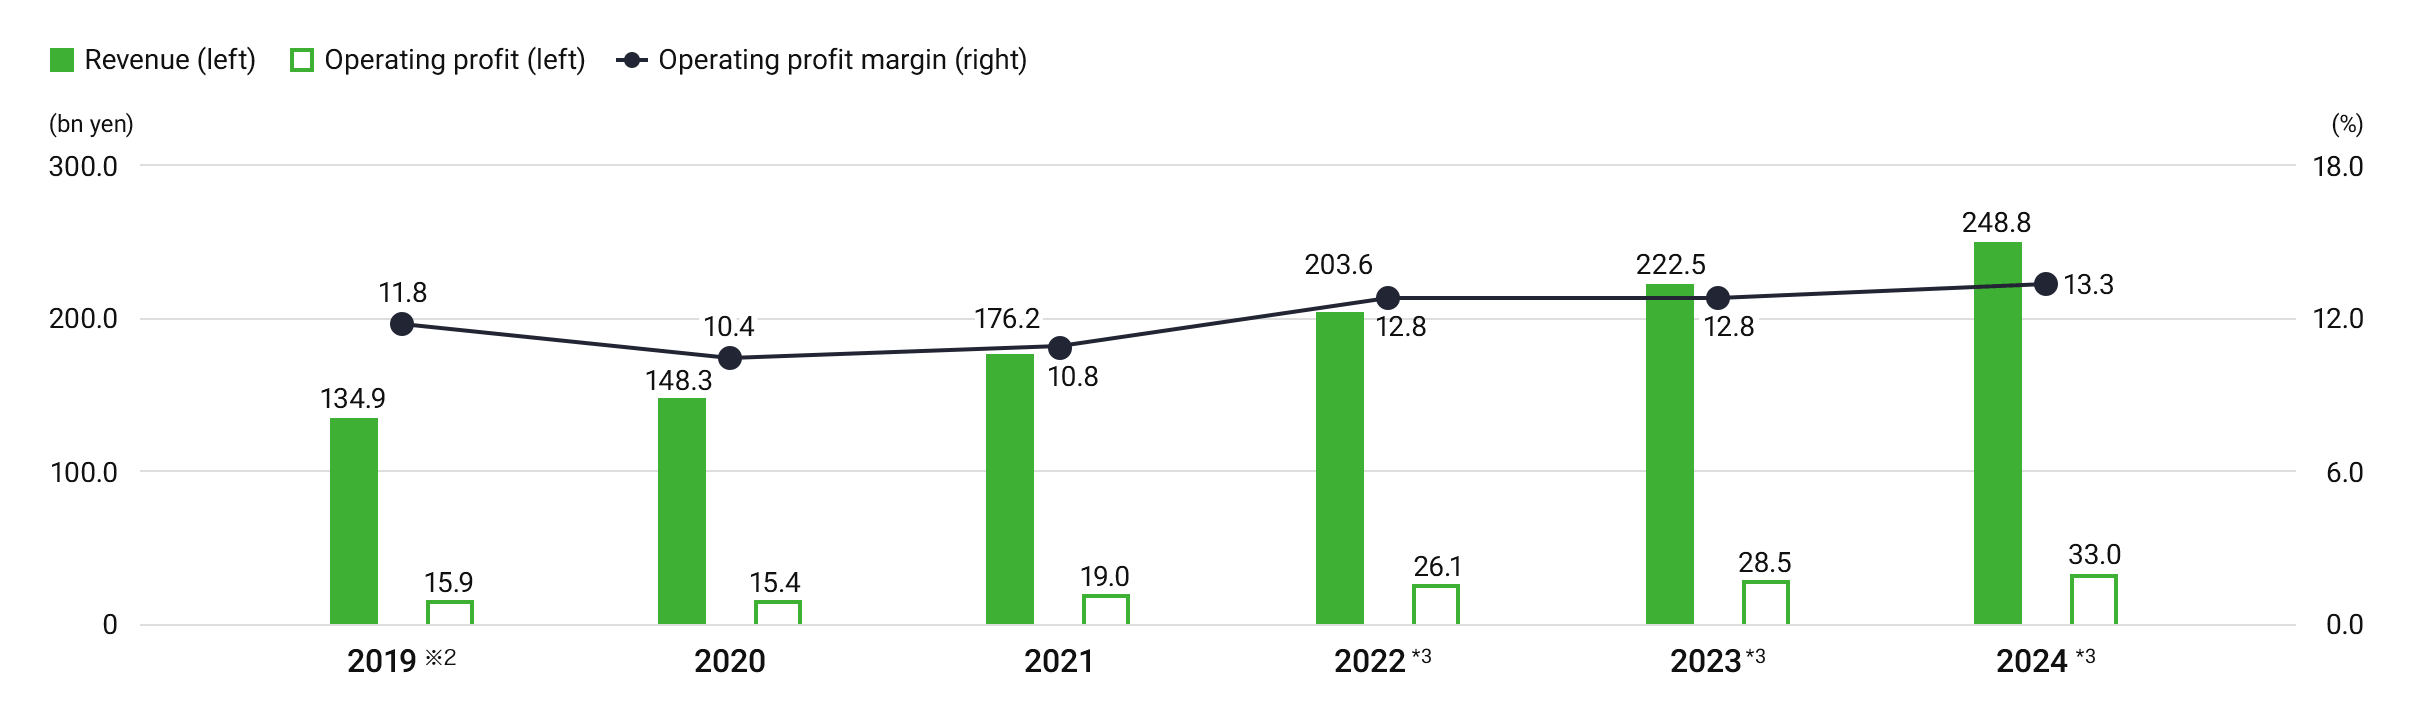
Revenue: Revenue from the decorative paints business increased from the previous year, despite the impact of soft market conditions, supported by price increases, an improvement in product mix, and yen depreciation. In the adjacencies business, revenue also rose, mainly driven by small-scale acquisitions of local businesses, which offset the impact of soft market conditions in existing businesses. As a result, total revenue grew by 11.8% year-on-year to JPY 248.8 billion.
Operating profit: Operating profit increased by 15.6% year-on-year to JPY 33.0 billion, driven by higher revenue despite higher SG&A expenses due to inflation.
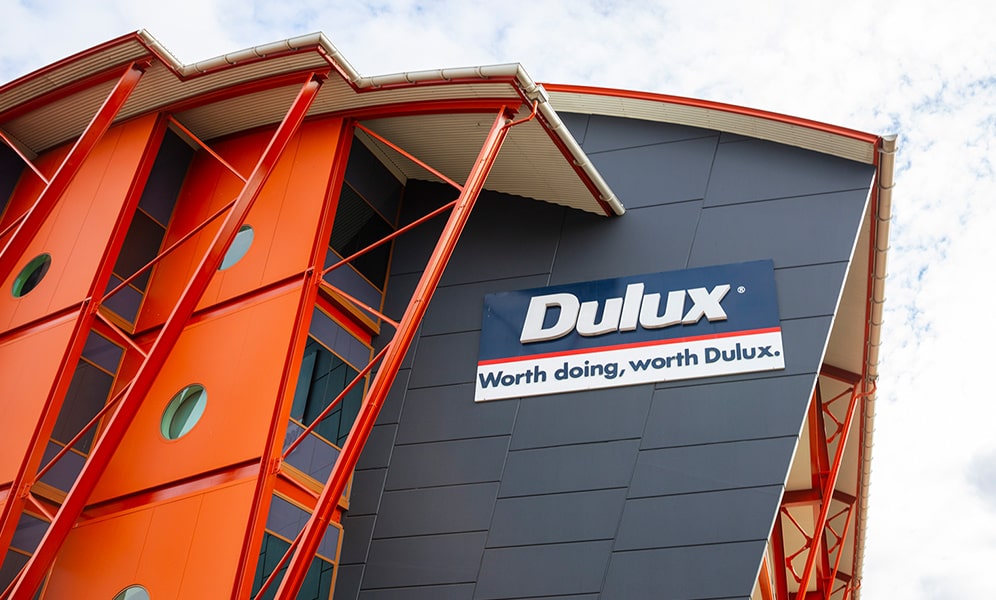
Market share: DGL (Pacific) has maintained the No.1 market share in Australia for decorative paints, both in volume and value terms.

Growth since the acquisition (2019)

By relentlessly focusing on continuous investment in premium brand products, consumer insights, innovations, marketing, customer services catering to retail and trade-use customers, DuluxGroup has continued to outpace the market growth. Furthermore, the company has complemented its consistent organic growth with multiple strategic and bolt-on acquisitions.
As a result, since the acquisition, revenue has grown by 85.4% and operating profit rose by 107.5%.

Revenue(*1): ¥248.8 bn (+11.8% YoY, +84.5% post-acquisition)
Operating profit(*1): ¥33.0 bn (+15.6% YoY, +107.5% post-acquisition)

Trends in revenue, operating profit, and operating profit margin

Trends in revenue, operating profit, and operating profit margin

Market share*4 (Australia Decorative): 50% (+0pt YoY / +2pt post-acquisition)

2019
2020
2021
2022
2023
2024
2019
48%
2020
50%
2021
50%
2022
50%
2023
50%
2024
50%
  • Segment basis (after elimination of inter-segment transactions and after PPA)
  • Pro forma figures. Including one-off items such as M&A cost
  • Due to a change in reporting segments within DuluxGroup, figures for 2022 onwards do not include Craig & Rose and Maison Deco
  • NPHD’s estimates of decorative paint market volume

DGL (Europe)

2024 results

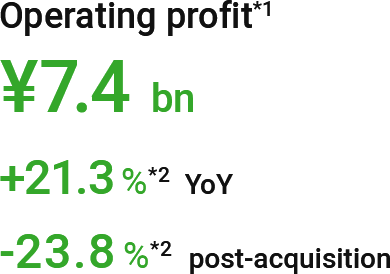
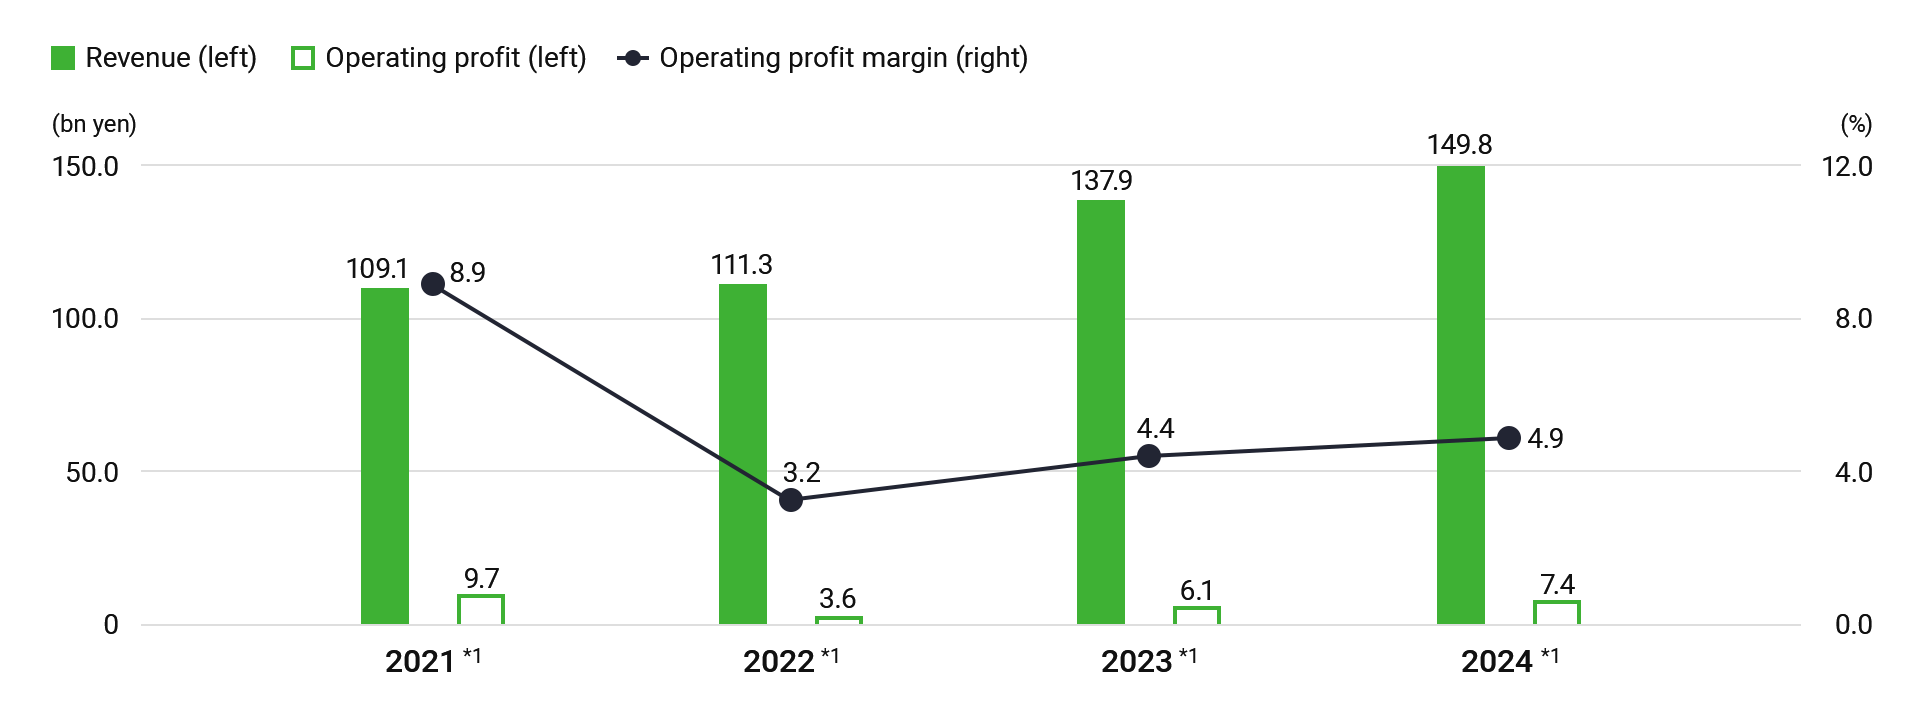
Revenue: Revenue from the decorative paints business increased year-on-year, despite sluggish sales volumes in France due to soft market conditions, supported by yen depreciation. In the adjacencies business, revenue also grew, as the impact of weak ETICS demand and a sluggish adjacencies market was offset by the new consolidation of NPT. As a result, total revenue rose by 8.6% year-on-year to JPY 149.8 billion.
Operating profit: Operating profit increased by 21.3% year-on-year to JPY 7.4 billion, supported by an improved gross profit margin and gains from the sale of the Craig & Rose factory, despite higher SG&A expenses due to inflation.
Market share: DGL (Europe) maintains a leading position in key European decorative paints markets, including Cromology’s No.1 market share in Italy and No.2 positions in France and Portugal, as well as JUB’s No.1 ranking in interior decorative paints in Slovenia, Croatia, Bosnia and Herzegovina, and Kosovo.

Growth since the acquisition (2022)

DuluxGroup is leveraging its core growth capabilities, developed through years of consistent expansion in the Pacific market, to accelerate growth, primarily through Cromology, the fourth-largest player in the European decorative paints market, and JUB, a leader in Central European decorative paint markets. Additionally, DuluxGroup is broadening its foundation in adjacency business through the acquisition of NPT, an Italy-based adhesives manufacturer.
As a result, since the time of acquisition, revenue has risen by 37.3%, with the consolidation of NPT offsetting declines in sales volumes in France.
Operating profit declined by 23.8%, primarily due to soft market conditions in France, M&A related expenses associated with NPT, and higher SG&A expenses driven by inflation.

Revenue(*1): ¥149.8 bn (+8.6% YoY, +37.3% post-acquisition)
Operating profit(*1): ¥7.4 bn (+21.3%(*2) YoY, -23.8%(*2) post-acquisition)

Trends in revenue, operating profit, and operating profit margin

Trends in revenue, operating profit, and operating profit margin

Market share*3

Cromology
Icon: building
No.1 in Italy and No.2 in France (Trade only) and Portugal in decorative paints market
JUB
Icon: paint
No.1 in Slovenia, Croatia, Bosnia and Herzegovina, and Kosovo in interior paints market
  • The 2021 figures represent the simple sum of pro forma figures for Cromology and JUB. JUB’s earnings for FY2022 are pro forma figures for 12 months converted to JPY at the following exchange rate: EUR/JPY=138.5 yen. Due to a change in reporting segments within DuluxGroup, figures for 2022 onwards include Cromology, JUB, NPT, Craig & Rose, and Maison Deco
  • Including one-off items such as M&A cost
  • NPHD’s estimates

Non-financial outcomes (2024 results)

DuluxGroup (Consolidated)
Icon: Human resources/organizations Human resources/organizations
  • Ratio of female employees: 34%
  • Ratio of women in managerial positions: 30.1%
Icon: Nature/environment Nature/environment
  • Controlled water usage through proper management following voluntary standards
    • Water consumed: -12.2% YoY
DGL (Pacific)
Icon: Human resources/organizations Human resources/organizations
  • Implements measures to increase the ratio of female employees in all job levels
    • Ratio of female employees: 37%
    • Ratio of women in managerial positions: 31%
    • More than doubled female representation at the Top 200 senior leaders conference, increasing to 39% from 15% in 2013
  • Investments in improving employee engagement
    • Employee engagement (FY2021): 80% (+800 bps vs. FY2017)
Icon: Brands Brands
  • Improving the brand awareness
    • Several DuluxGroup brands have been voted by consumers as Australia’s most trusted brand in their respective product category, while Dulux is consistently voted one of Australia’s most trusted brands overall and has industry-high spontaneous brand recognition
Icon: Nature/environment Nature/environment
  • Initiatives aimed at reducing energy consumption – Commenced solar install program at operating sites to achieve target of 50% renewable electricity consumption by 2030
    • Renewable energy consumption (% of total): 3.5% (+110 bps YoY)
    • Renewable electricity consumption (% of total): 6.9% (+240 bps YoY)
DGL (Europe)
Icon: Human resources/organizations Human resources/organizations
  • Ratio of female employees: 29%
  • Ratio of women in managerial positions: 28%
Icon: Nature/environment Nature/environment
  • Promoted the use of renewable energy*
    • Renewable energy consumption (% of total): 2% (-950 bps YoY)
    • Renewable electricity consumption (% of total): 7.6% (-1,320 bps YoY)

* Continued solar use in JUB and renewable power purchase in Cromology, though at reduced rate versus 2022 due to market pricing changes


Related data

Links to related pages

This website requires some functions similar to those of cookies.
If you allow our cookies, we use them to collect statistical data about your visit to improve our service. Videos are also presented by using YouTube. Cookies and other means are used only when you opt to watch videos. If you do not allow our cookies, only technical cookies are used.
Click/tap here for details.