
Font Size
1. Front Cover
Good afternoon, everyone. I’m Yuichiro Wakatsuki, Co-President of Nippon Paint Holdings.
Thank you very much for taking the time today to participate in this update meeting on our Medium-Term Plan for FY2021-2023.
2. Executive Summary
I would like to begin with an executive summary.
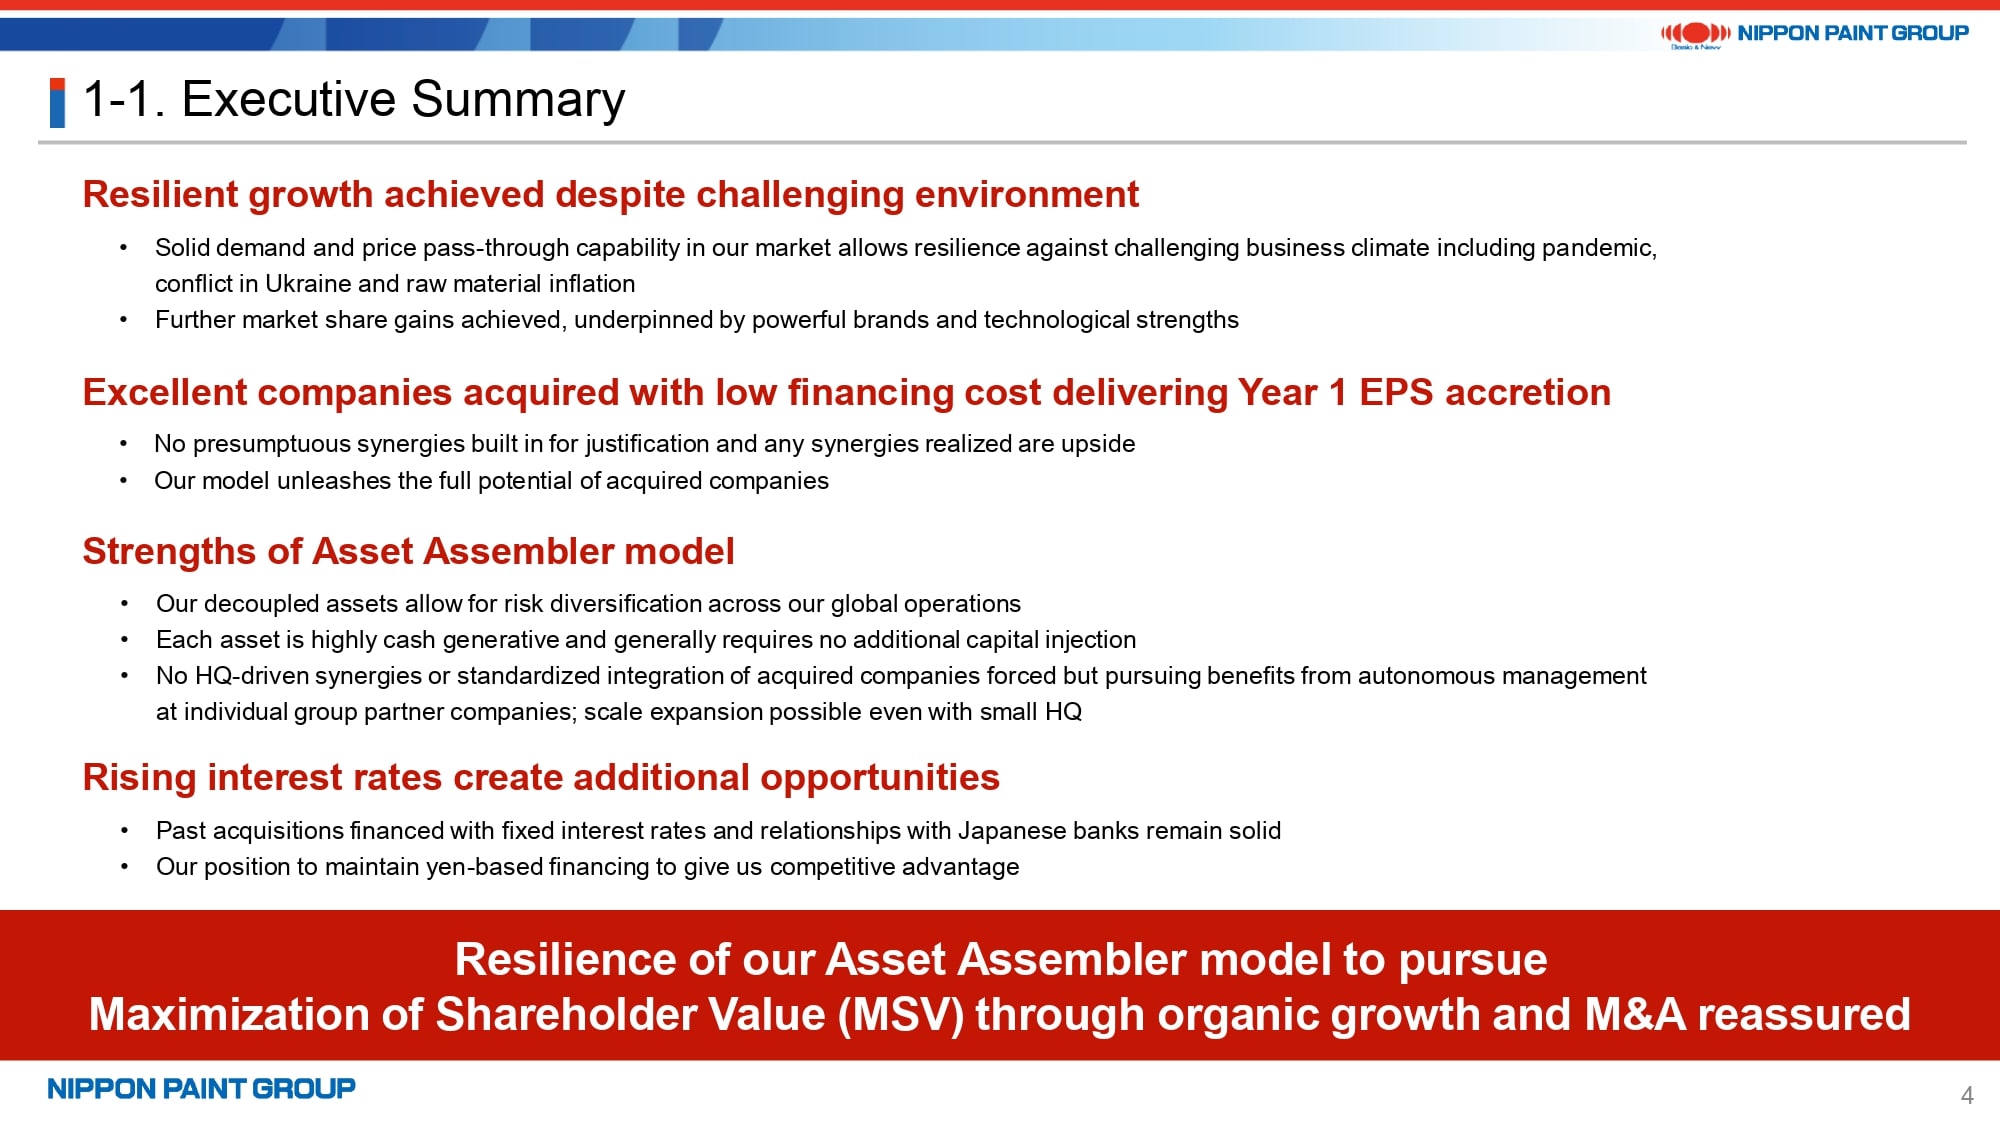
To recap our progress, we have reaffirmed the strength of our business model going into the final year of our three-year Medium-Term Plan (MTP) despite the dramatic change in the business climate since we started the MPT in March 2021. Today I’m going to explain our robust business model for pursuing MSV to complement my explanation at last year’s update meeting on the MTP.
Firstly, I would like to emphasize the solid demand across all end markets of every group partner company, our cost pass-through capability in each market, and our capability to gain market share by taking advantage of the current challenging environment. Our front lines are facing difficulties such as supply chain bottlenecks. However, I realized that our Group has the capability to turn risks into opportunities by allowing the excellent management teams of our partner companies to make decisions and respond to various obstacles with agility, rather than the headquarters taking the initiatives and deciding what to do.
Secondly, our business model of building up excellent assets through M&A using a low financing cost started with the acquisition of DuluxGroup and Betek Boya in FY2019. Next was the full integration of the Asia JVs and the Indonesia business in FY2021 and the acquisitions of Cromology and JUB in FY2022. All these acquisitions have significantly contributed to EPS (earning per share) accretion. I believe our M&A model allows us to unleash the potential of excellent companies that join the Nippon Paint Group.
Every asset of our Group is highly cash generative. For instance, no additional capital injection is required even for our partner company in Türkiye where inflation is accelerating rapidly. In addition, our partner companies are generating cash in China despite concerns of many investors about geopolitical risk. Our Chinese partner companies are making investments for growth and have constantly paid dividends to Nippon Paint Holdings (the holding company). I keenly feel that our so-called decoupled assets featuring local production for local consumption can demonstrate their true worth based on their high market shares and profit margins in their local markets all the more under the current challenging business climate. Nippon Paint Holdings was restructured into a small and lean headquarters in FY2022 because our business model encourages autonomous collaboration among our partner companies without unnecessary HQ-led intervention. I believe this has enabled us to build a foundation for pursuing further growth as a true Asset Assembler.
Lastly, to answer a question from many investors regarding our view of risk as interest rates increase, we believe that the current environment is giving us an opportunity. That is to say, we will continue yen-based financing and maintain our solid relationships with Japanese banks, which we believe give us a competitive advantage.
It’s been already nearly two years since Wee Siew Kim and I were appointed the Co-Presidents of Nippon Paint Holdings. During this time, we started out communicating with each other via virtual meetings due to the pandemic. With the lifting of COVID regulations, we have been able to see each other more often. As a result, the communication between us has become much closer. In addition, all the Directors attended the general meeting of shareholders at the end of March 2023 and utilized this opportunity to engage in intensive strategy discussions, including updates on the MTP.
We are committed to meeting the expectations of investors with the goal of achieving Maximization of Shareholder Value (MSV) as our sole mission.
3. Gap Analysis Between Original Plan and Current Guidance (1)
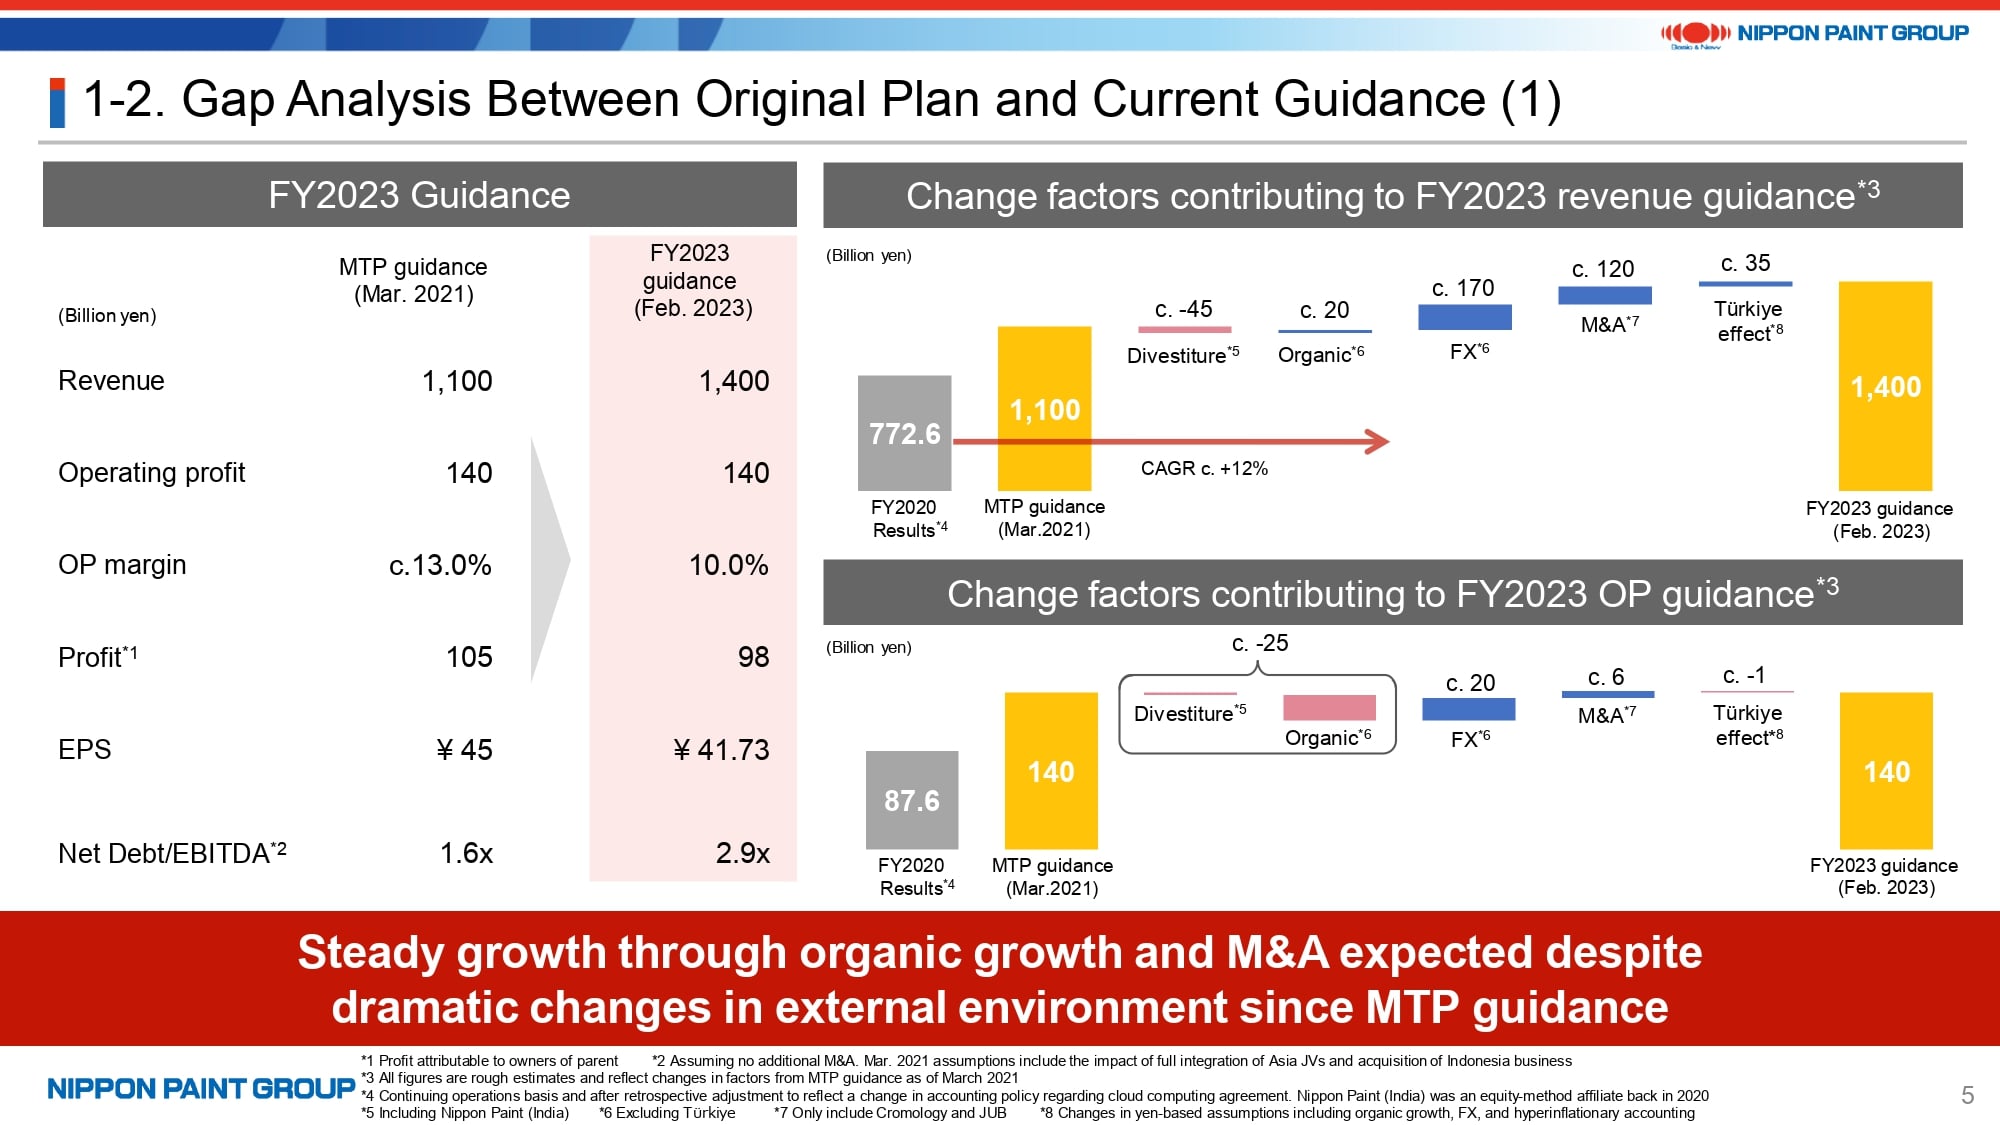
The purpose of this meeting is to give updates on our MTP. However, we are presenting no numerical updates today because we have already released our final year guidance for FY2023 in February. This page provides a comparative analysis between our MTP guidance created in March 2021 and FY2023 guidance released in February.
The waterfall graph on the right side of this page uses rough estimates in order to strictly give investors an idea of factors that contributed to the gap between our MTP guidance and FY2023 guidance.
Our revenue guidance for FY2023, created in March 2021, was 1,100 billion yen. However, we have increased our revenue guidance for FY2023 to 1,400 billion yen. Of the three businesses that were transferred to Wuthelam Group in FY2021, the decorative paints business in India (Nippon Paint India) was an equity-method affiliate and the automotive coatings businesses in India and Europe were consolidated subsidiaries in FY2020. Revenue in FY2020 excluding the automotive businesses in India and Europe as discontinued operations was 772.6 billion yen. The MTP revenue guidance of 1,100 billion yen includes these three businesses, whose total revenue was estimated to be around 45 billion yen in FY2023 as of March 2021. Excluding this number from the 1,100 billion yen MTP revenue guidance gives you a comparison under the same conditions.
The actual exchange rates used in FY2020 and the assumed exchange rates as of March 2021 were roughly the same. Our organic revenue excluding Türkiye based on these exchange rates was around 20 billion yen higher than the MTP guidance created in March 2021. The real CAGR of revenue from FY2020 to FY2023 is expected to be around 12%. Our MTP guidance assumed CAGR revenue growth of around 10%, which excluded the Indonesia and India businesses but included Türkiye. This shows that our Group has outperformed the MTP guidance. On top of this, we expect effects of weaker yen and the acquisitions of Cromology and JUB, combined with the Türkiye effect totaling of around 35 billion yen from the significant combined impact of revenue growth in local currency, unfavorable exchange rate and application of hyperinflationary accounting (IAS29) at Betek Boya.
I just stated that organic revenue is expected to be higher than the MTP guidance by around 20 bn yen. For your information, the MTP revenue guidance of 1,100 billion yen includes a stretch target and is slightly higher than the number we arrived at by adding up individual items. As a result, organic revenue is expected to be more than 20 billion yen higher than the MTP guidance.
In terms of operating profit, the combined effect of divestitures and organic growth is expected to be around negative 25 billion yen due to unexpected events such as raw material inflation and the conflict in Ukraine. Meanwhile, we expect the positive effects of FX and M&A and the overall Türkiye effect with operating profit slightly below the MTP guidance resulting from positive operating profit growth in local currency combined with the negative impacts of FX and hyperinflationary accounting (IAS29).
All in all, our Group expects to achieve steady growth in the final year of the MTP driven by higher-than-expected organic growth despite the challenging business environment, combined with the contributions from M&As.
4. Gap Analysis Between Original Plan and Current Guidance (2)
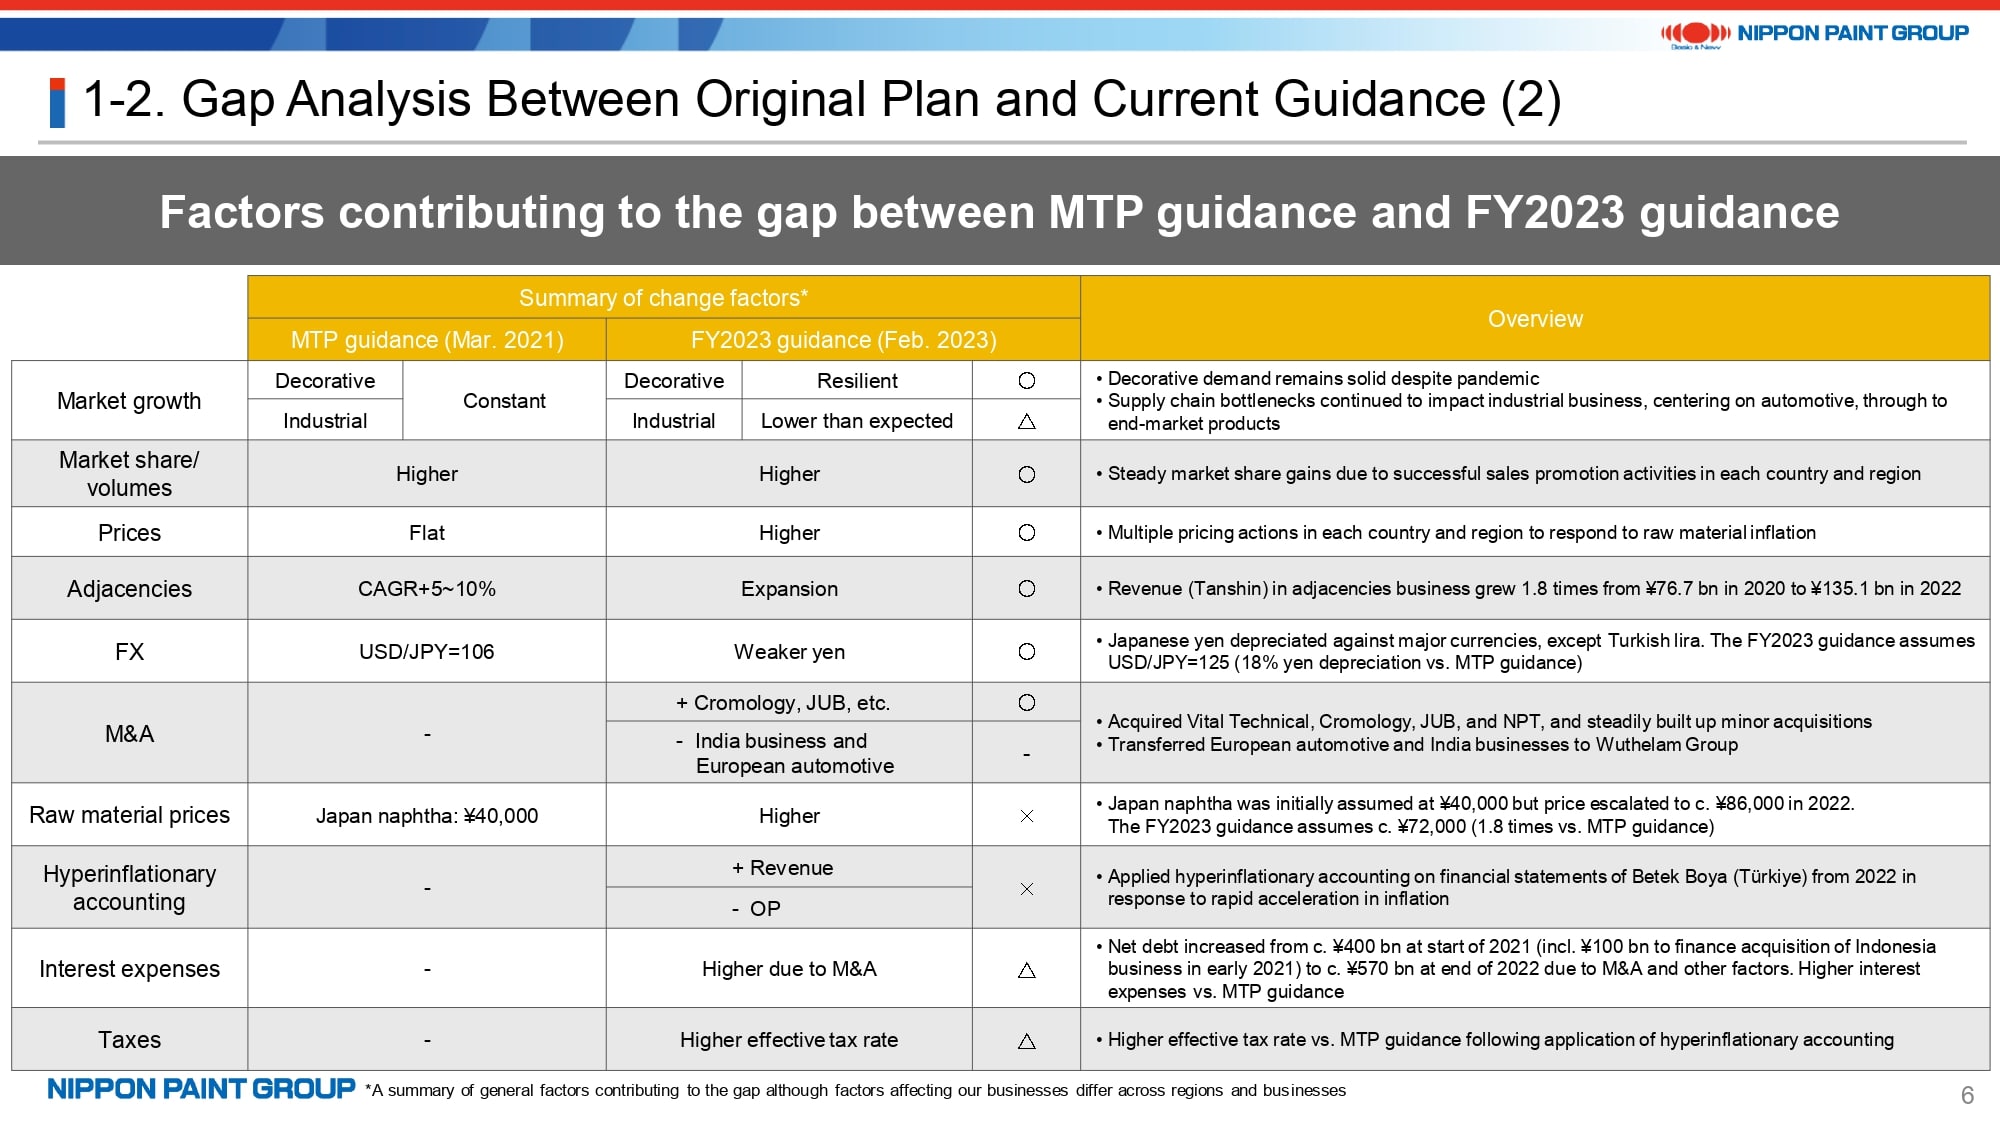
This page provides an analysis of factors that contributed to the gaps between the MTP guidance and FY2023 guidance.
In summary, the decorative paints market was underpinned by very resilient demand growth, although not constant growth, and the industrial coatings market struggled due to the pandemic and supply chain bottlenecks. In addition, we were able to solidly increase sales volumes and raise selling prices in many regions in response to raw material inflation.
The expansion of the adjacencies business was greater than expected. Growth was driven by the Selleys brand of DuluxGroup and the acquisitions of Vital Technical in Malaysia and JUB, which has strengths in ETICS (External Thermal Insulation System).
The absolute amount of interest expenses increased due to higher debt associated with M&As, although the average interest rate has not changed much because our borrowings are on fixed rates. In addition, the effective tax rate is higher than the level assumed in the MTP guidance. As a result, net profit and EPS in the FY2023 guidance are slightly below the MTP guidance.
5. Analysis by Region
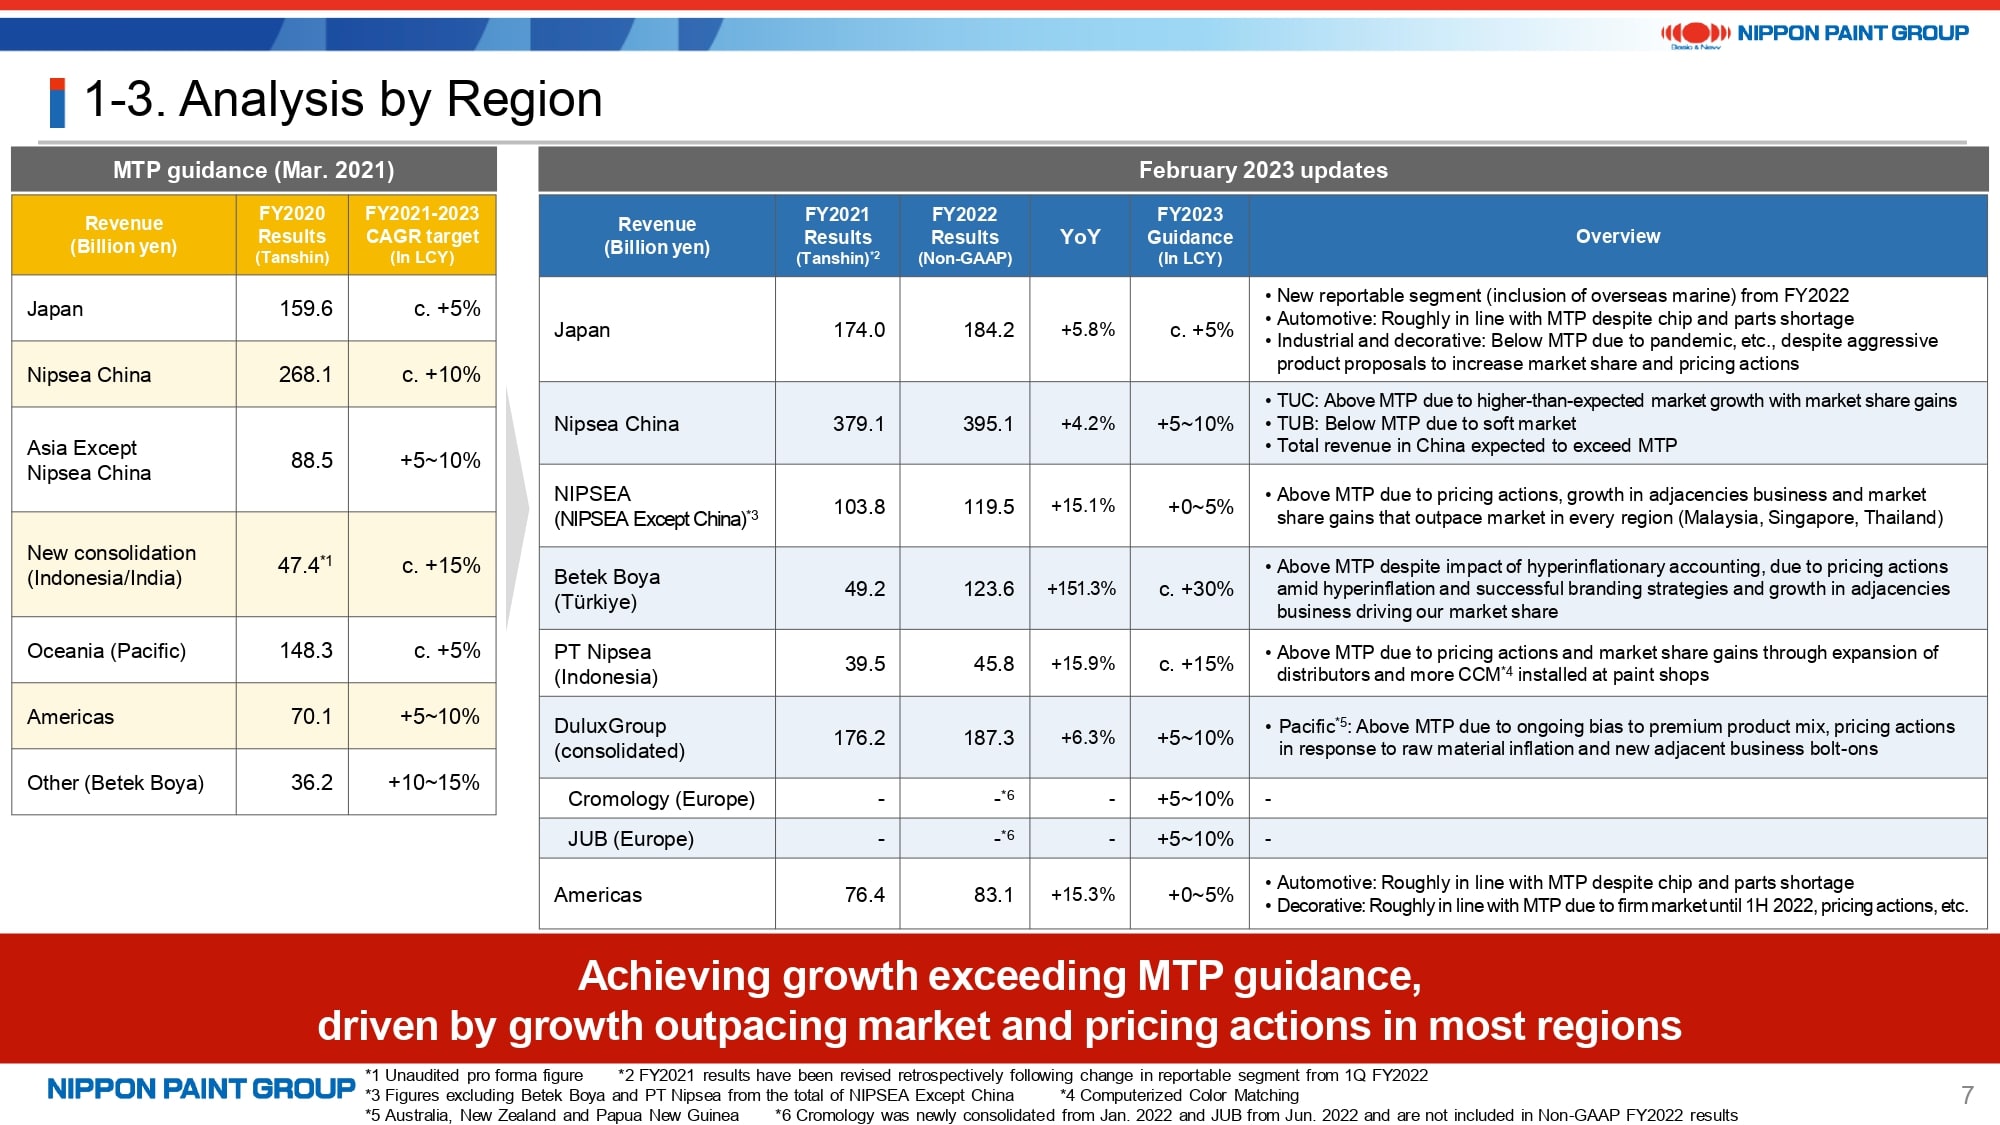
The last page of the executive summary provides the analysis of our performance and outlook by region.
Please note that there was a change in reportable segment beginning with FY2022. The FY2021 results were adjusted retrospectively but not the FY2020 results and prior years. The analysis on this page is strictly to give you an image of our performance and outlook by region. The FY2021 results are on a Tanshin base and the FY2022 results are on a Non-GAAP base. Both use constant exchange rates with FY2021 as the base year and exclude the effects of M&As. Cromology and JUB are thus not included in the FY2022 results.
As you can see, we expect to achieve higher revenue growth in most regions than we expected in the MTP guidance, in particular in China, Australia, Malaysia Group, as well as Türkiye after including multiple factors. In terms of operating profit, we expect to be in line with the MTP guidance in many of our regions but not in Japan and China where our performance is expected to be below the MTP guidance.
This concludes the executive summary.
6. Growth Potential of Decorative Paints Market in China
Now, I will briefly explain each asset starting on page 9.
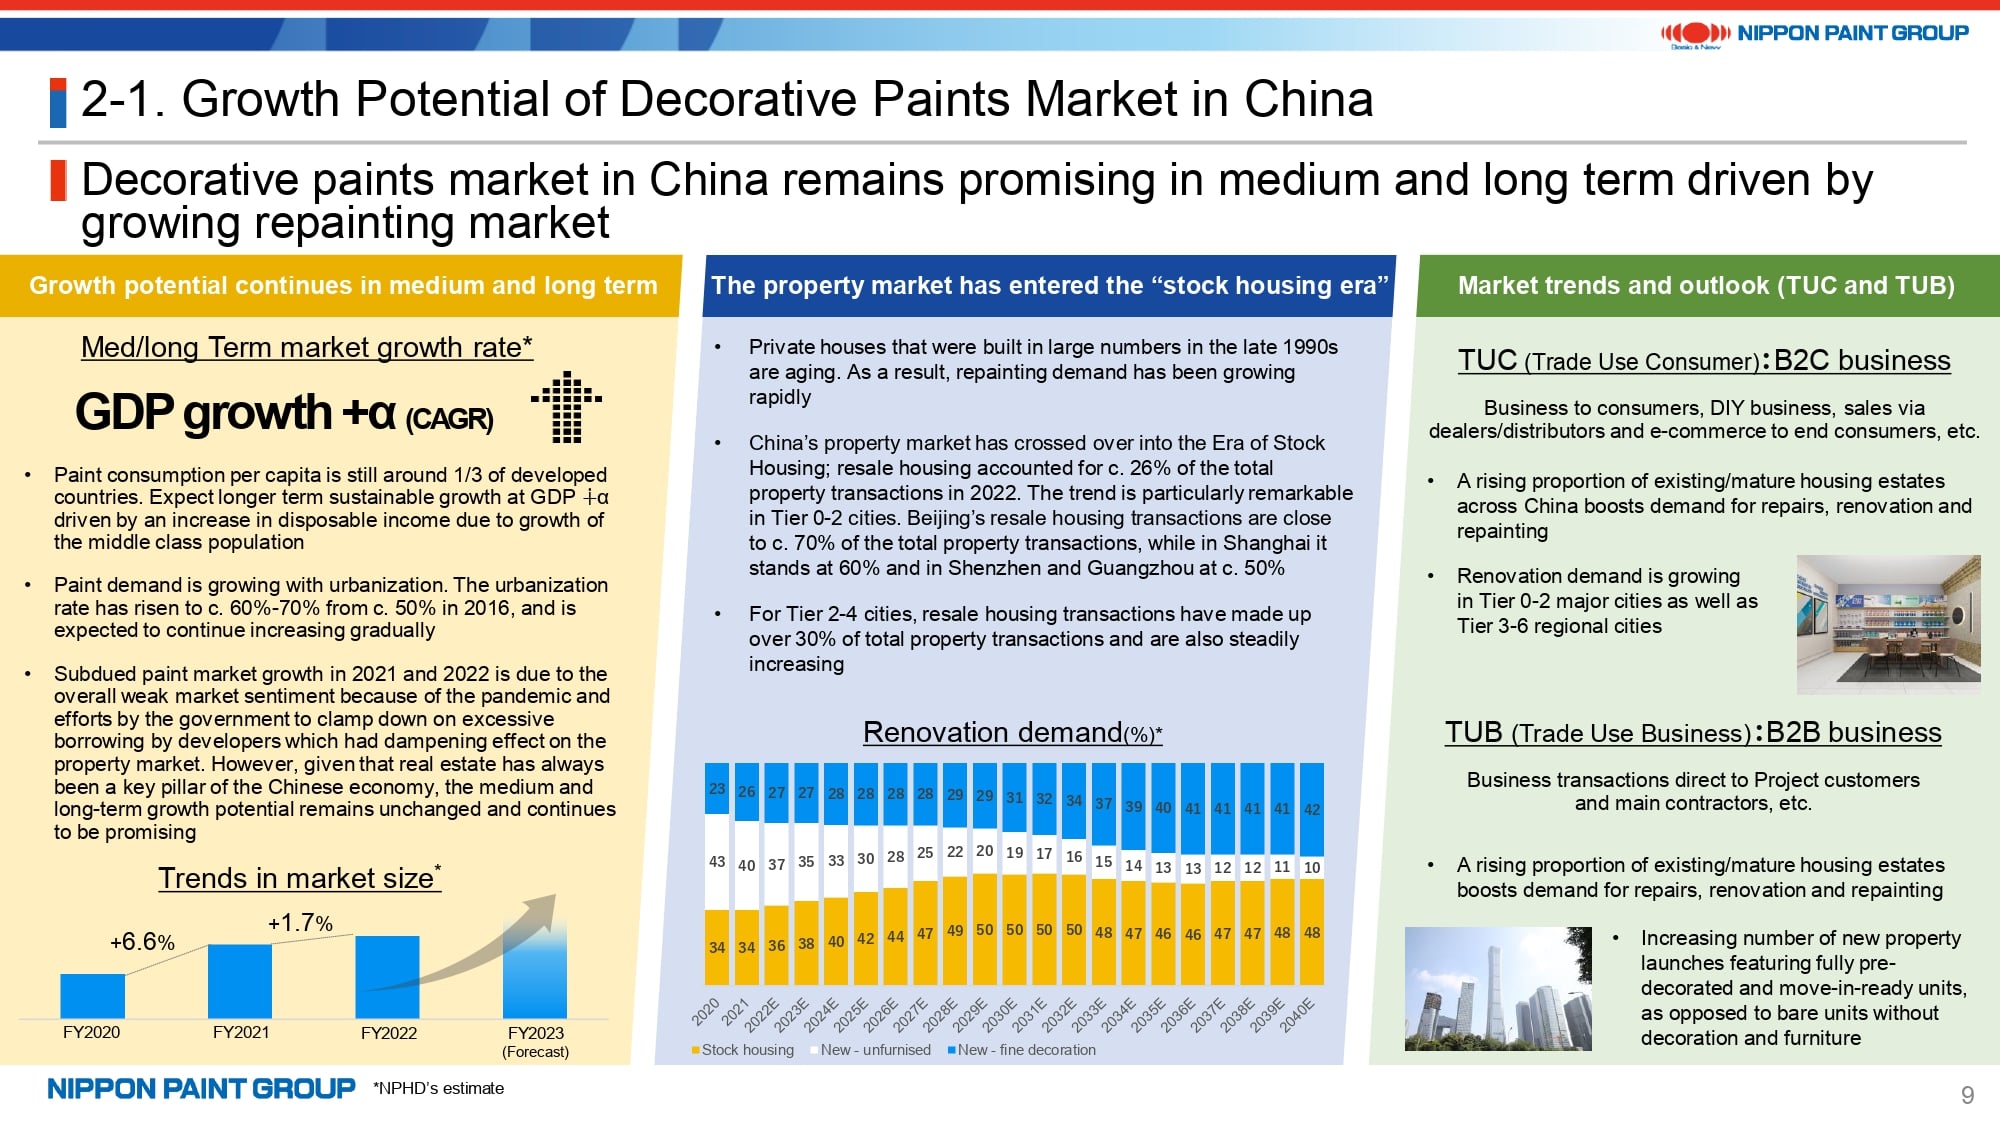
I’ll start with an overview of the decorative paints market in China. Market growth has been slower than expected during the past few years due to the pandemic and deterioration of the property market. However, we continue to believe that this market has a potential for GDP+α growth in the medium and long term. As you can see in the graph in the lower middle of the page, China has entered the stock housing era. We believe demand growth in the resale housing market will sufficiently offset the slowdown in demand growth in the new build market. In addition, per capita paint consumption is expected to increase with economic growth. Our key action points are how we can increase both our market share and operating profit margin in this growth market.
7. Nipsea China Decorative (TUC)
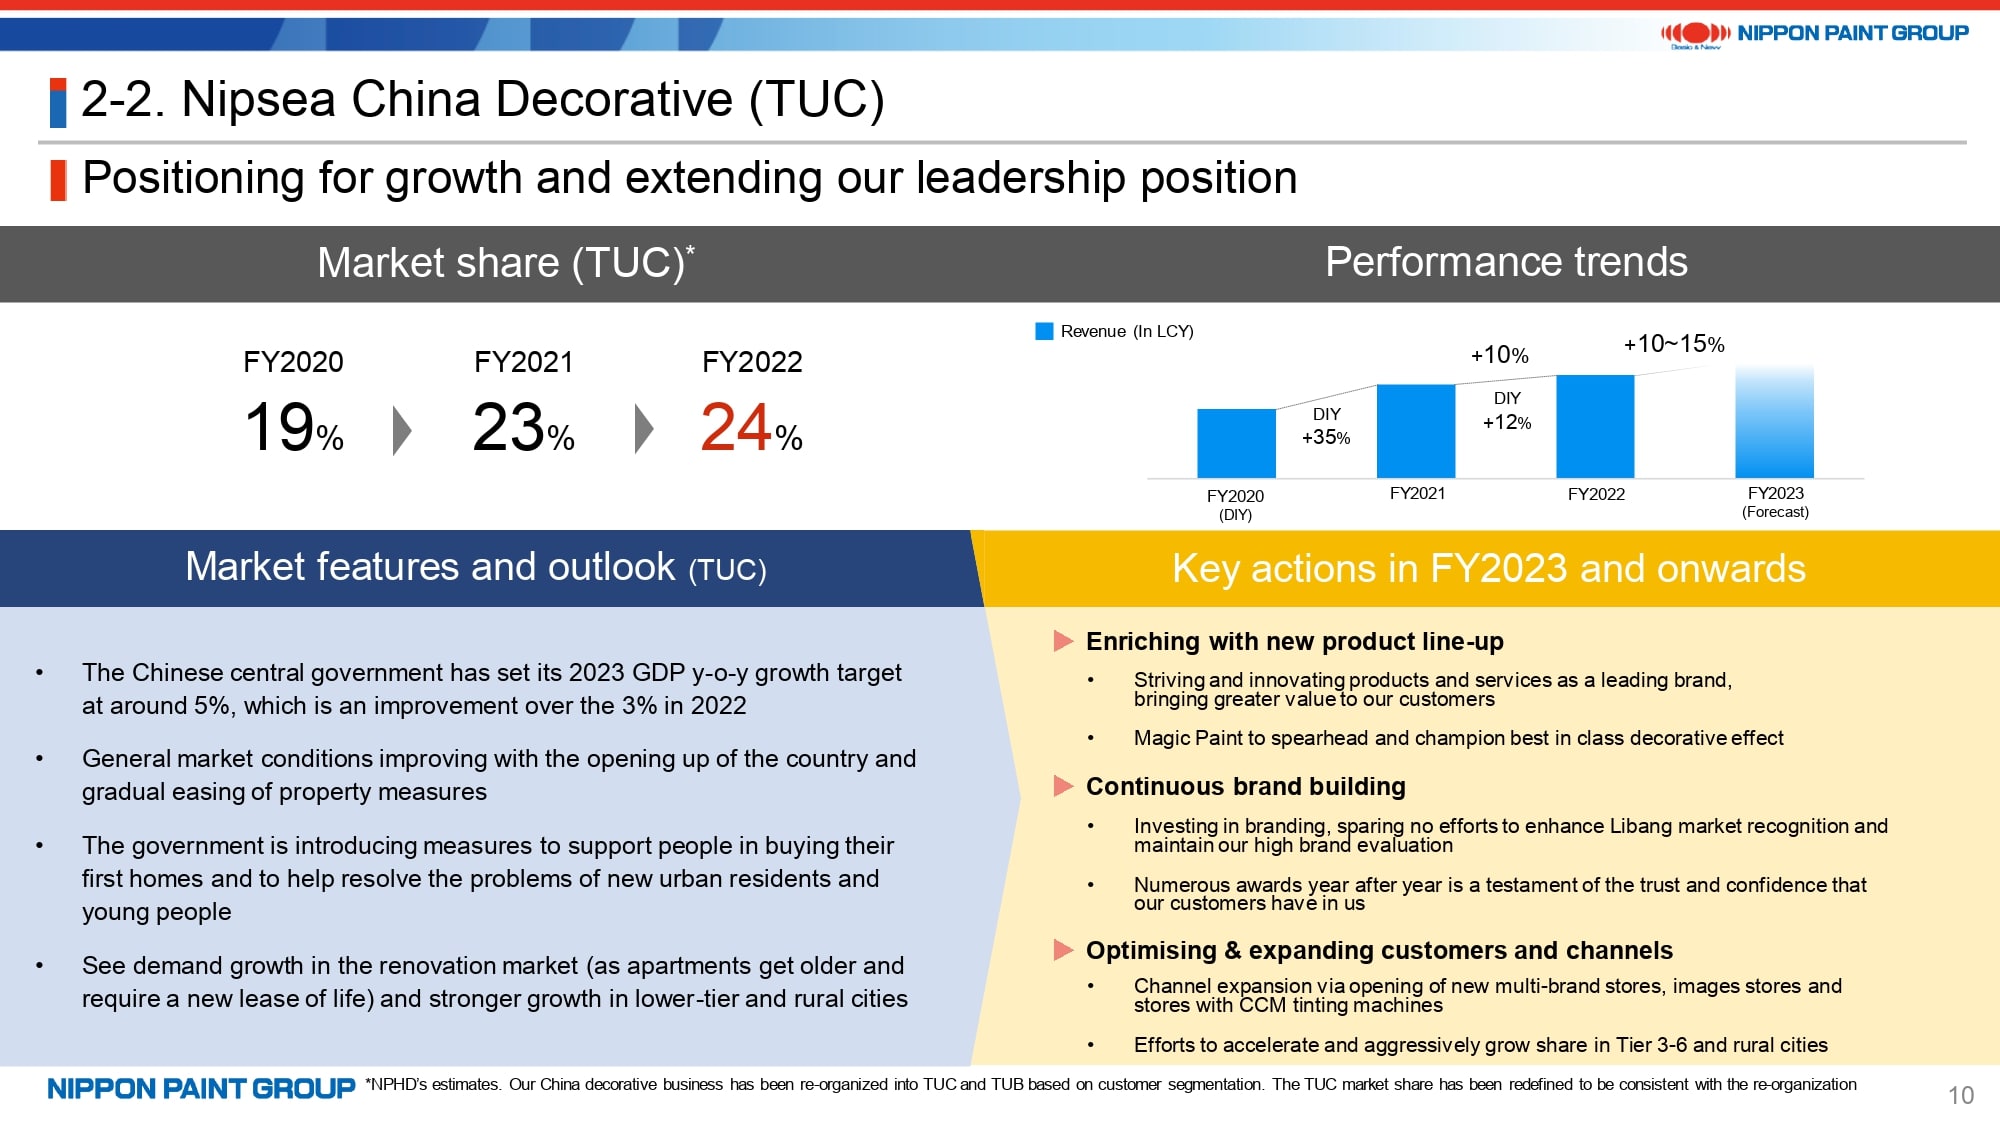
Given these circumstances, we can better capitalize on our strengths in the TUC market. In fact, we have continued to increase our market share in this segment in FY2022.
We are planning to increase our sales volumes of economy products as well as our sales in Tier 3-6 cities, markets which we haven’t focused much on previously, by leveraging our brand strengths.
8. Nipsea China Decorative (TUB)
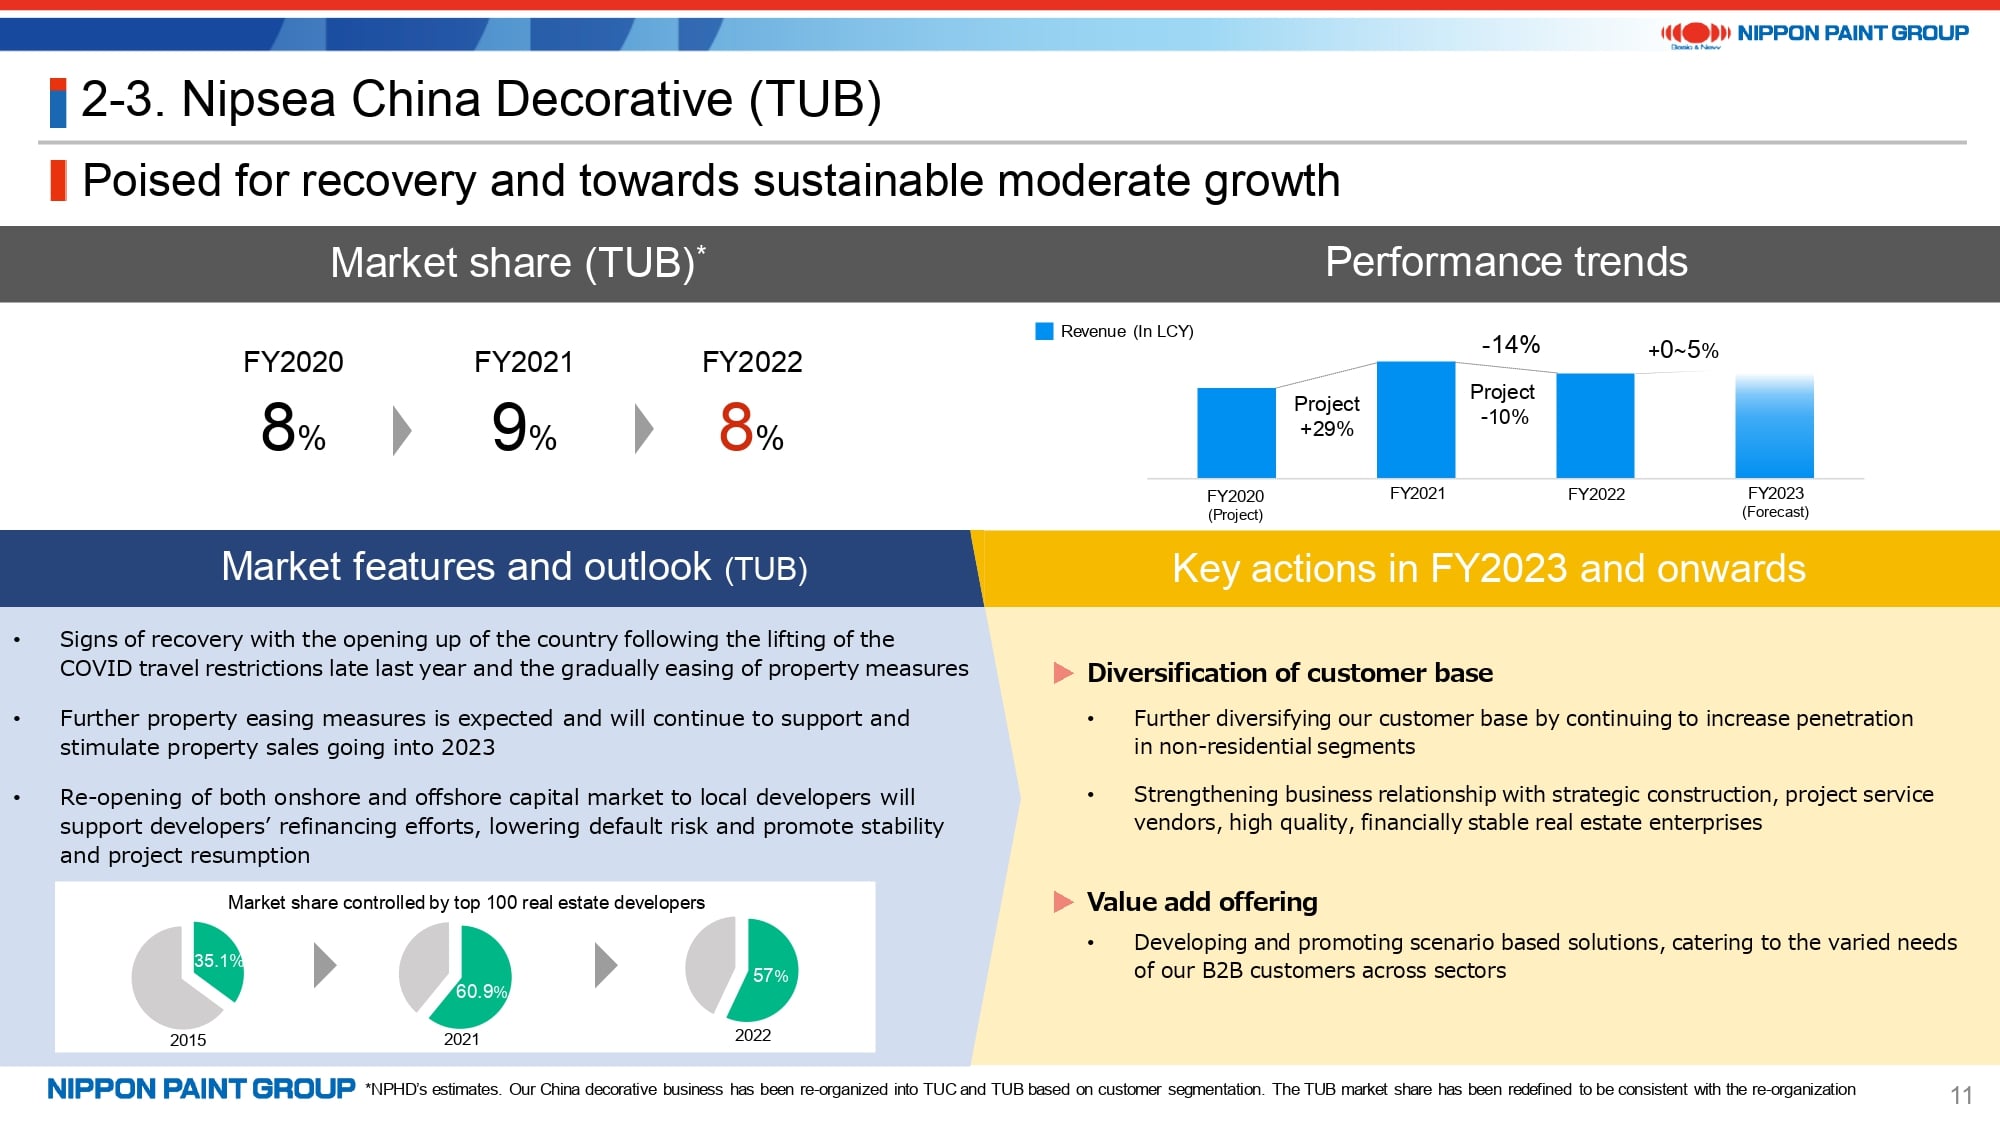
In the TUB market, on the other hand, our market share slightly decreased due to difficulties at developers who are our key strategic customers and measures such as limiting transactions with non-cash on delivery customers with credit risk. However, we believe our leading competitors are more or less in the same situation.
We will build a more diversified customer base to even out risks in pursuit of both market share gains and operating profit growth. This is the market we will continue to focus on because there is still much room for taking market share away from midsize and small competitors and the market is very large.
9. For Reference: Nipsea China 1Q FY2023 Preliminary Results
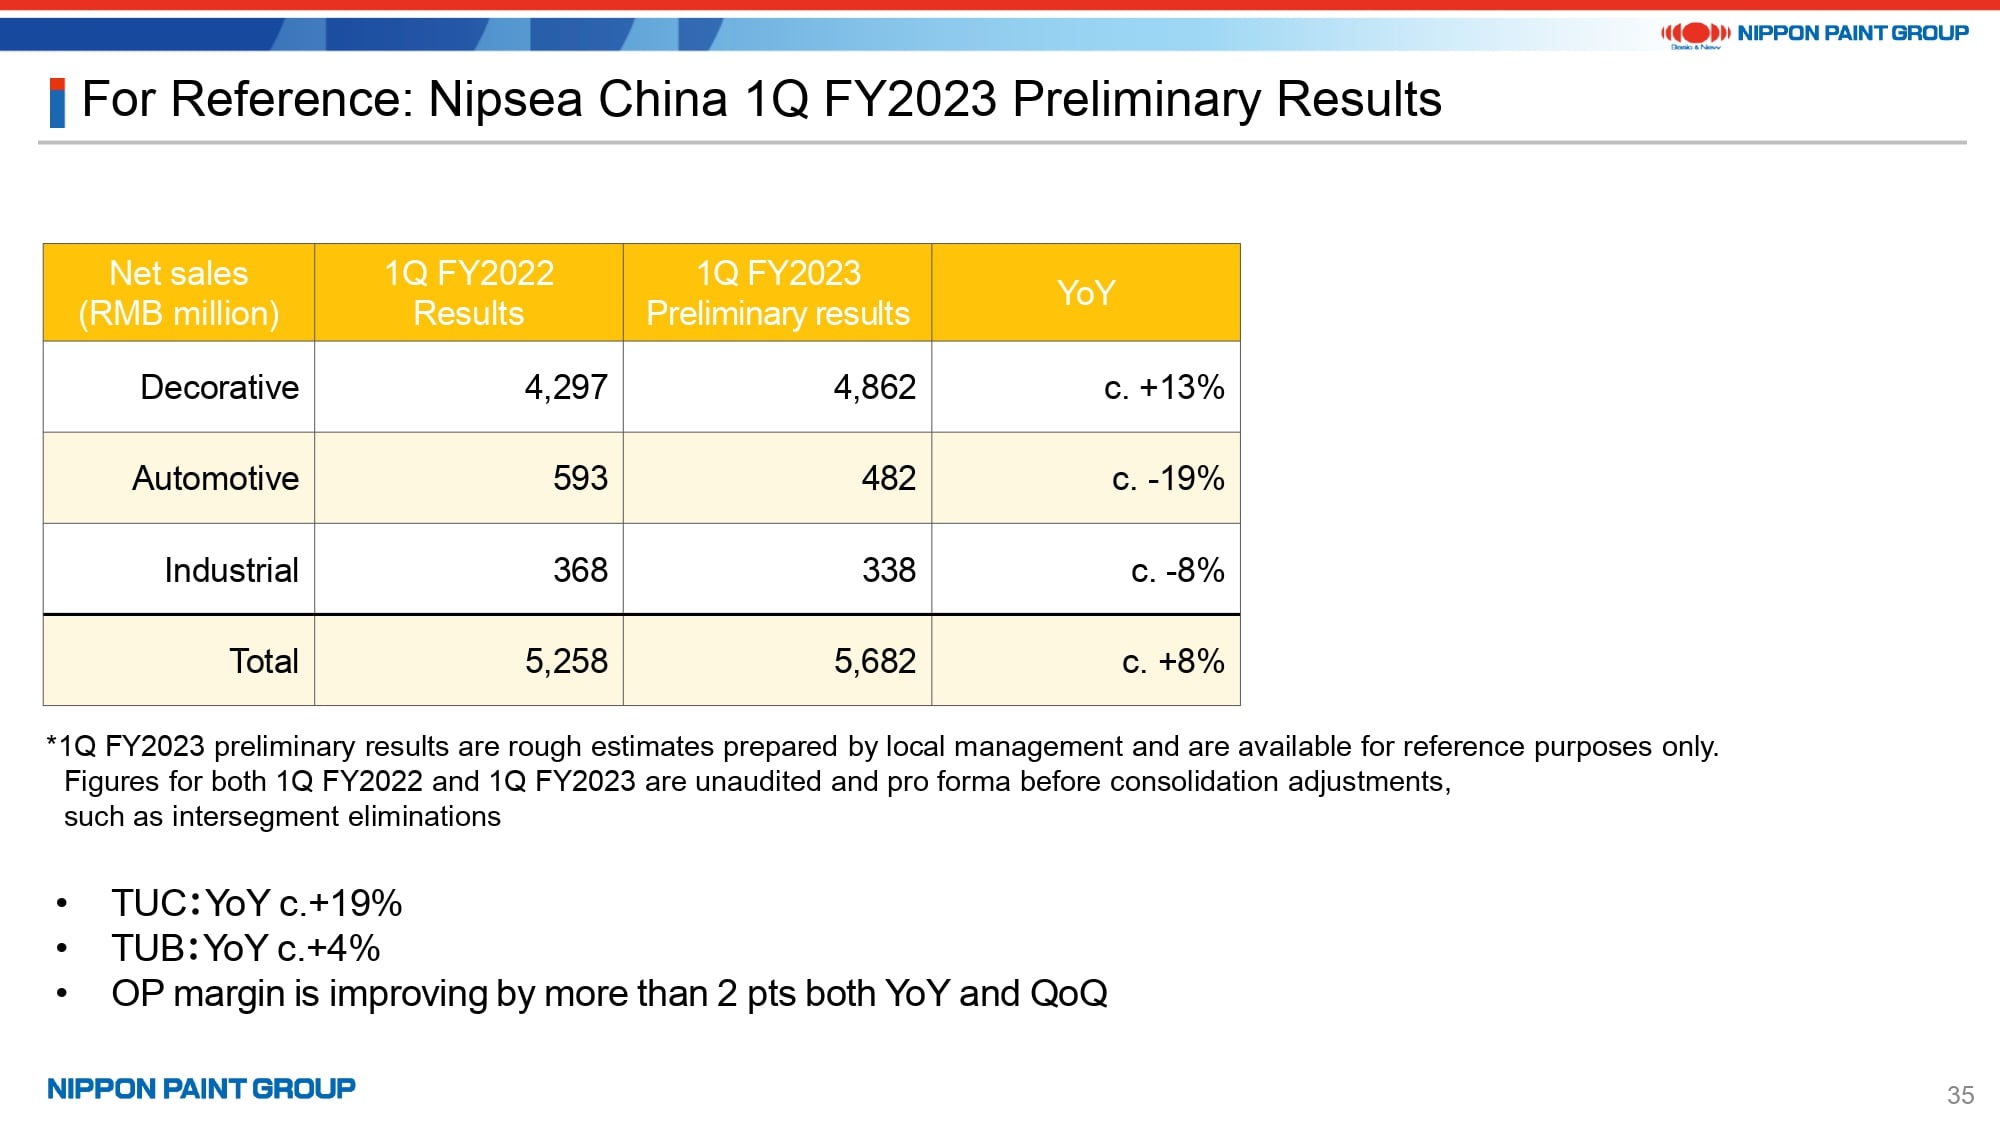
Page 35 of the presentation provides preliminary results at Nipsea China in 1Q FY2023.
The figures are in local currency and do not reflect exchange rate fluctuations and are before consolidation eliminations. The information therefore is intended for your reference only.
The overall decorative revenue grew 13% YoY. The breakdown is 19% growth in the TUC segment and 4% growth in the TUB segment. On the other hand, automotive revenue decreased by a double-digit percentage YoY due to the soft market, while revenue in the overall China business increased by around 8% YoY.
Our operating profit margin, which is the key metric, we expect an improvement of at least two pts YoY and QoQ. More information will be provided at the 1Q FY2023 results announcement in May.
The information provided on this page may not be sufficient. However, we have decided to provide preliminary figures as an exception as a follow-up to my previous statement that the performance improvement at Nipsea China will depend on its performance in March.
The preliminary figures for other regions are mixed. For instance, some regions were affected by unfavorable weather and the cost of raw materials is remaining elevated in other regions. All things considered, I cannot say that our performance improved consistently across all regions. But I can tell you that we are moving in the right direction overall.
10. Betek Boya (Türkiye)
Going back to page 12, which is about Betek Boya in Türkiye.
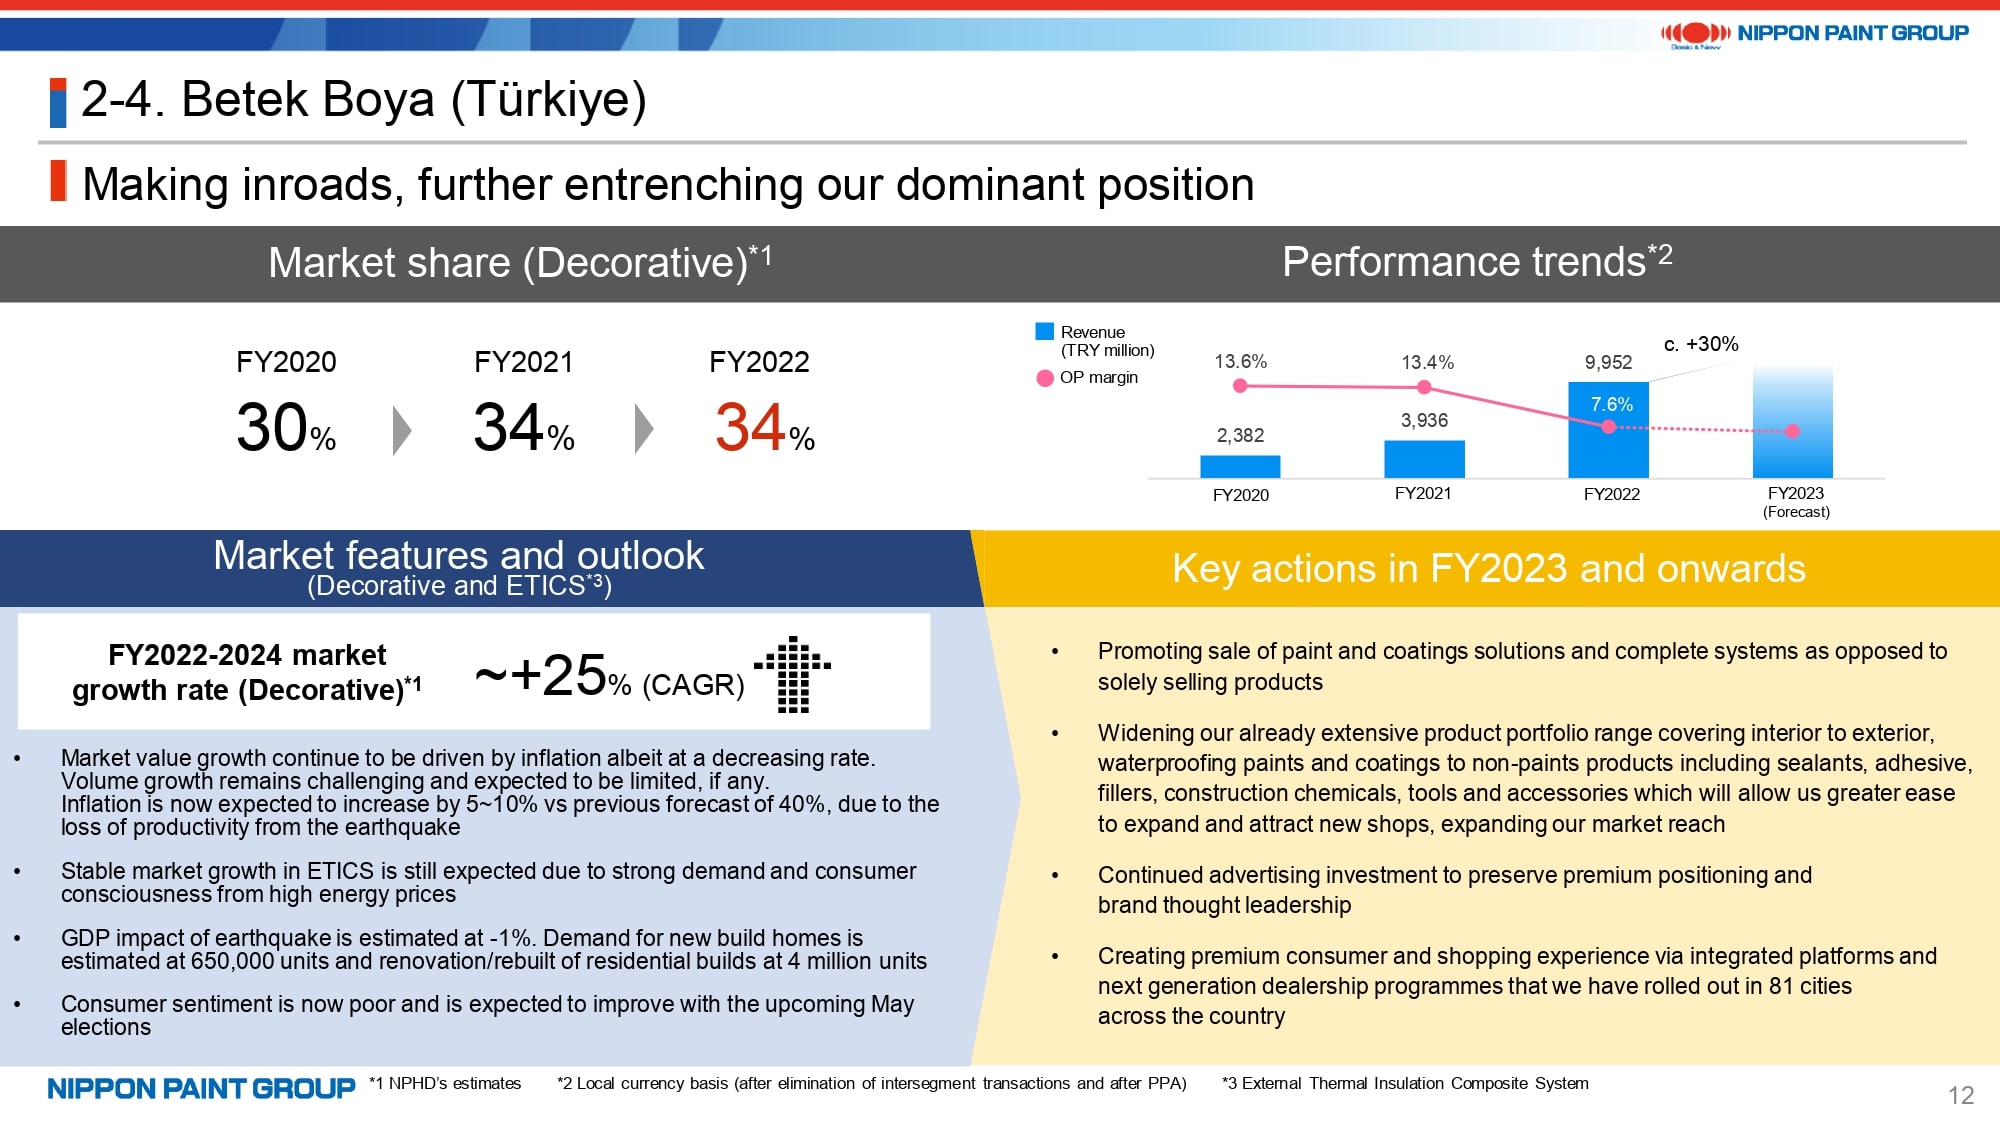
This region is vulnerable to significant risk factors. Although there were no casualties or damage to factories, the earthquake had a negative impact on the domestic GDP and consumer sentiment. However, we are not concerned about the medium and long-term outlook for this market because of solid demand underpinned by the population of 80 million. We are paying attention to changes in monetary policies and the possibility of a turnaround in consumer sentiment after the presidential election.
11. PT Nipsea (Indonesia)
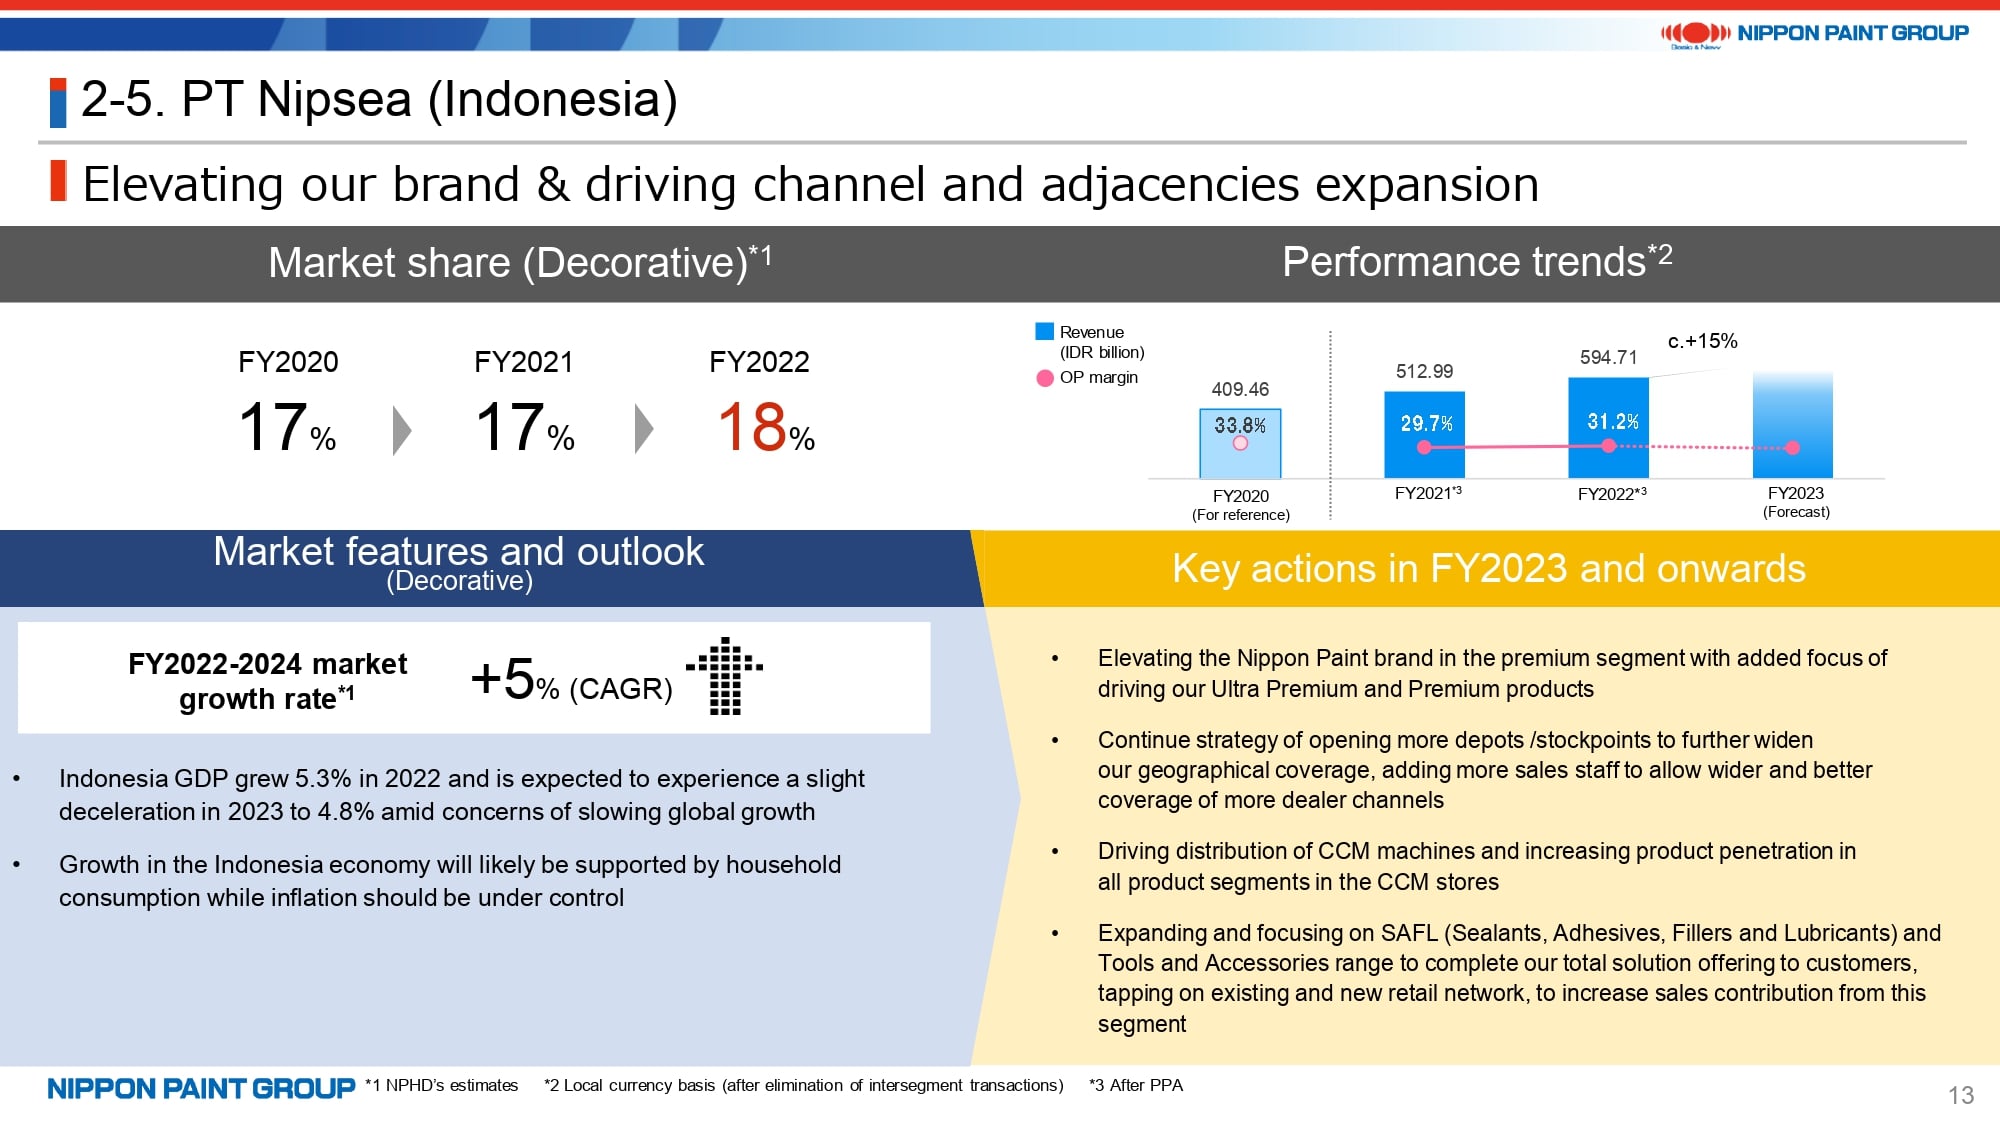
The outlook for the Indonesia business is the same as I have stated on prior occasions.
Although there are uncertainties, such as the presidential election scheduled for early 2024, I believe we can achieve solid growth by shifting to premium products and using aggressive sales promotion activities.
12. DuluxGroup (Pacific・Europe)
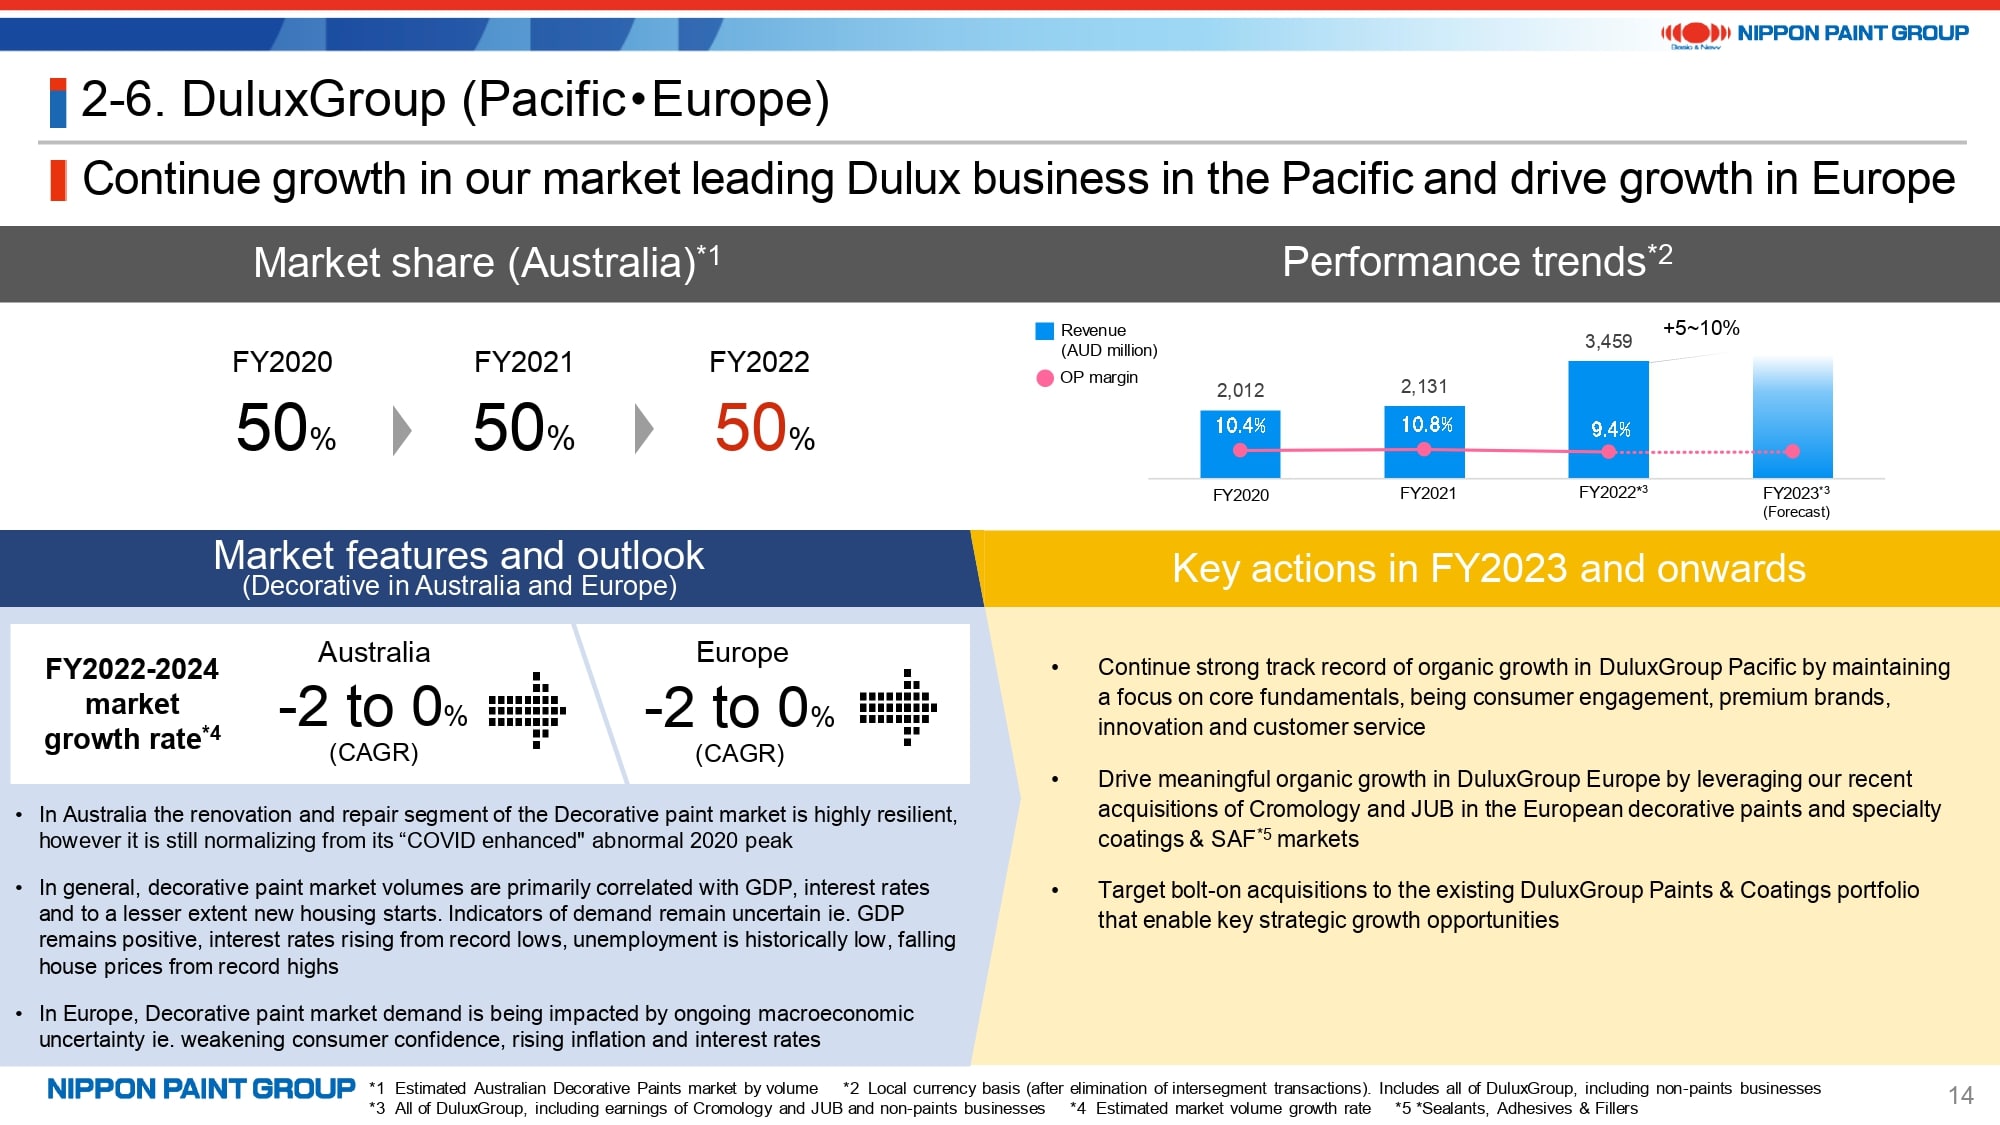
We have started to manage DuluxGroup based on the Pacific segment, which is centered on Australia and New Zealand, and the Europe segment, which is centered on Cromology and JUB.
Both segments are in mature markets with limited growth potential. Therefore, the key is how we are going to increase our market share in these segments. The market share in terms of sales volume on this page has not changed much. However, we estimate that the market share in terms of monetary sales has increased considerably in step with the shift to premium products in the Pacific segment.
13. Japan Group
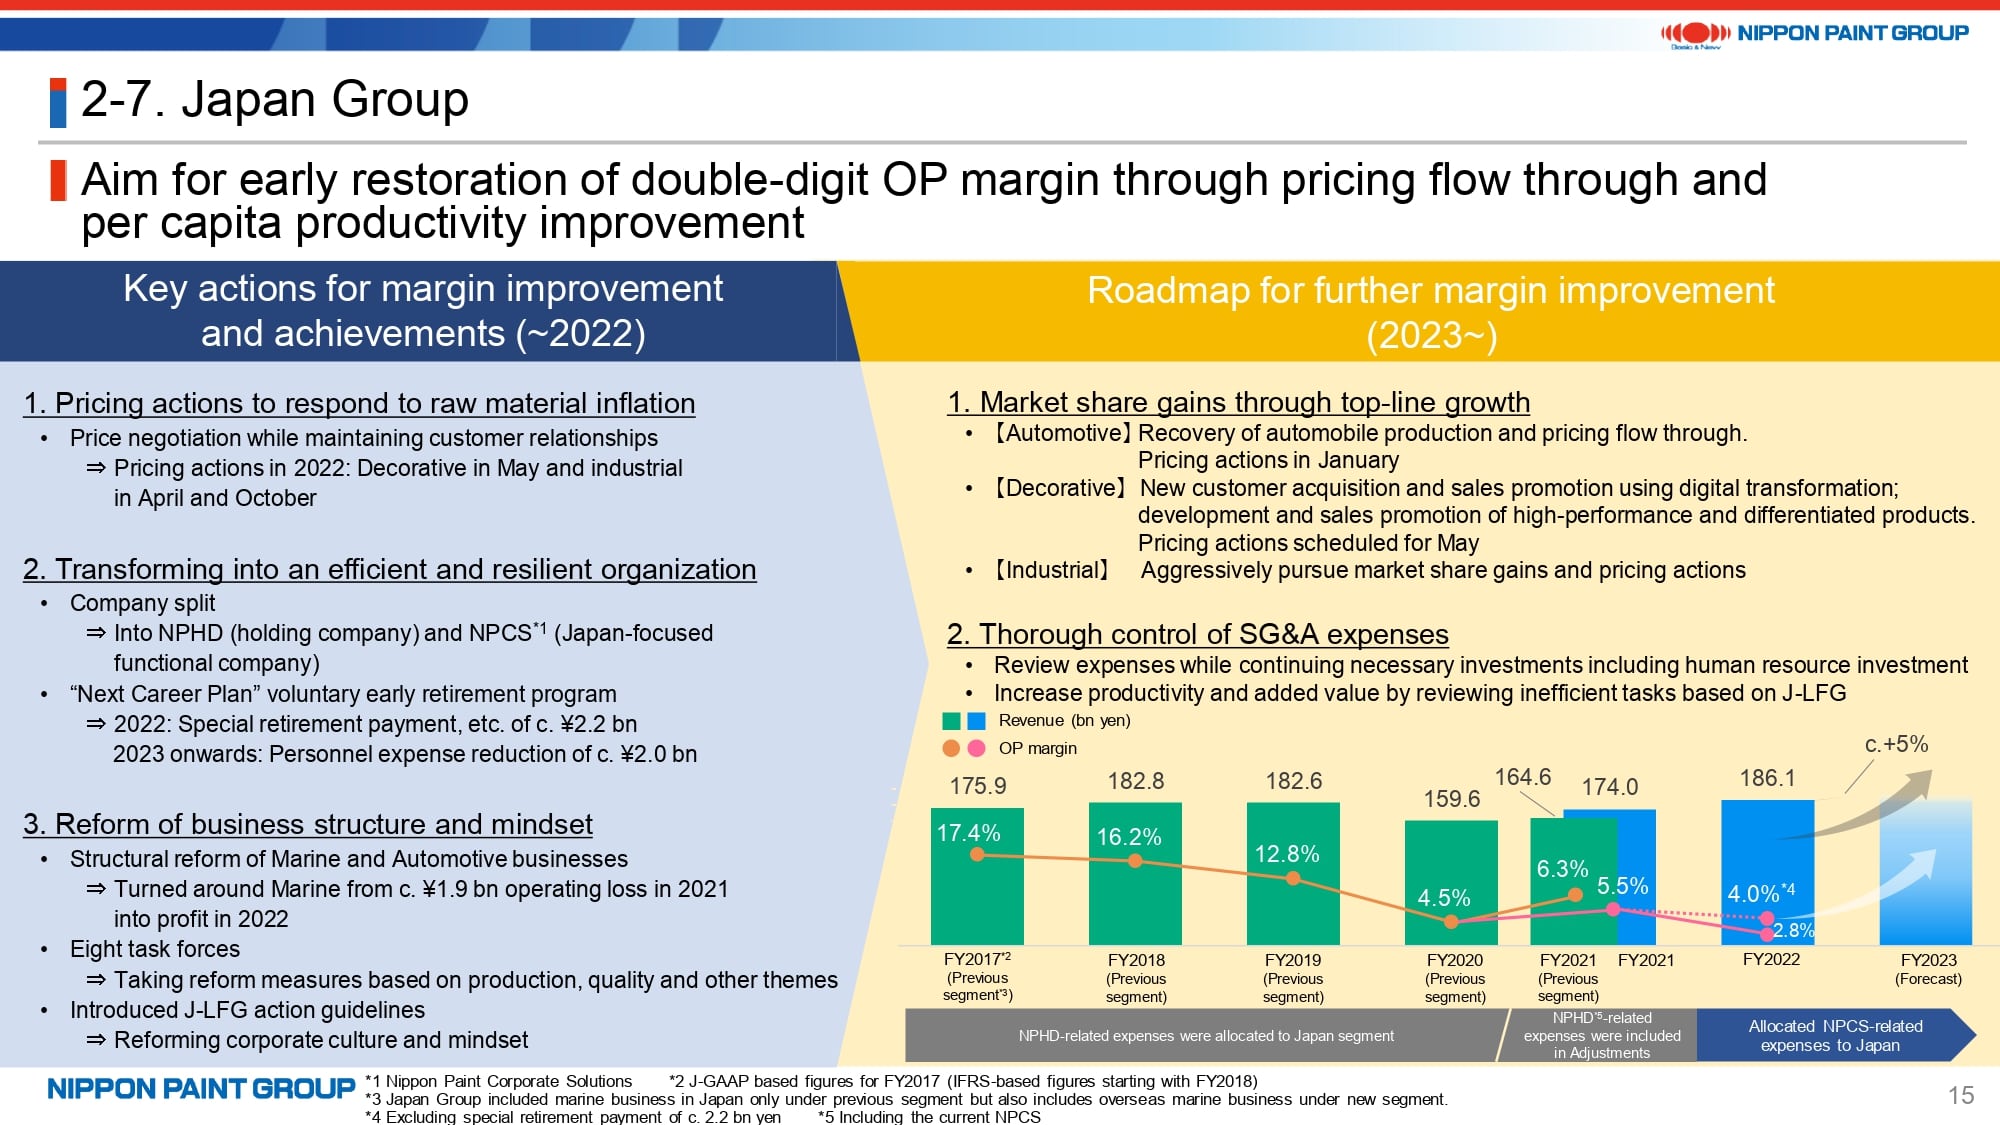
Lastly about the Japan Group.
As you may know, this segment had a very high operating profit margin in the past. The key is whether we can successfully restore profitability by establishing in this segment the culture of LFG (Lean for Growth) that is designed to achieve growth by eliminating waste, rather than through mere cost cutting.
We expect to continue facing a challenging environment, such as sticky raw material cost inflation. However, we believe we can achieve solid growth in this mature market in the medium and long-term, as DuluxGroup has done, by taking actions such as streamlining operations and raising selling prices.
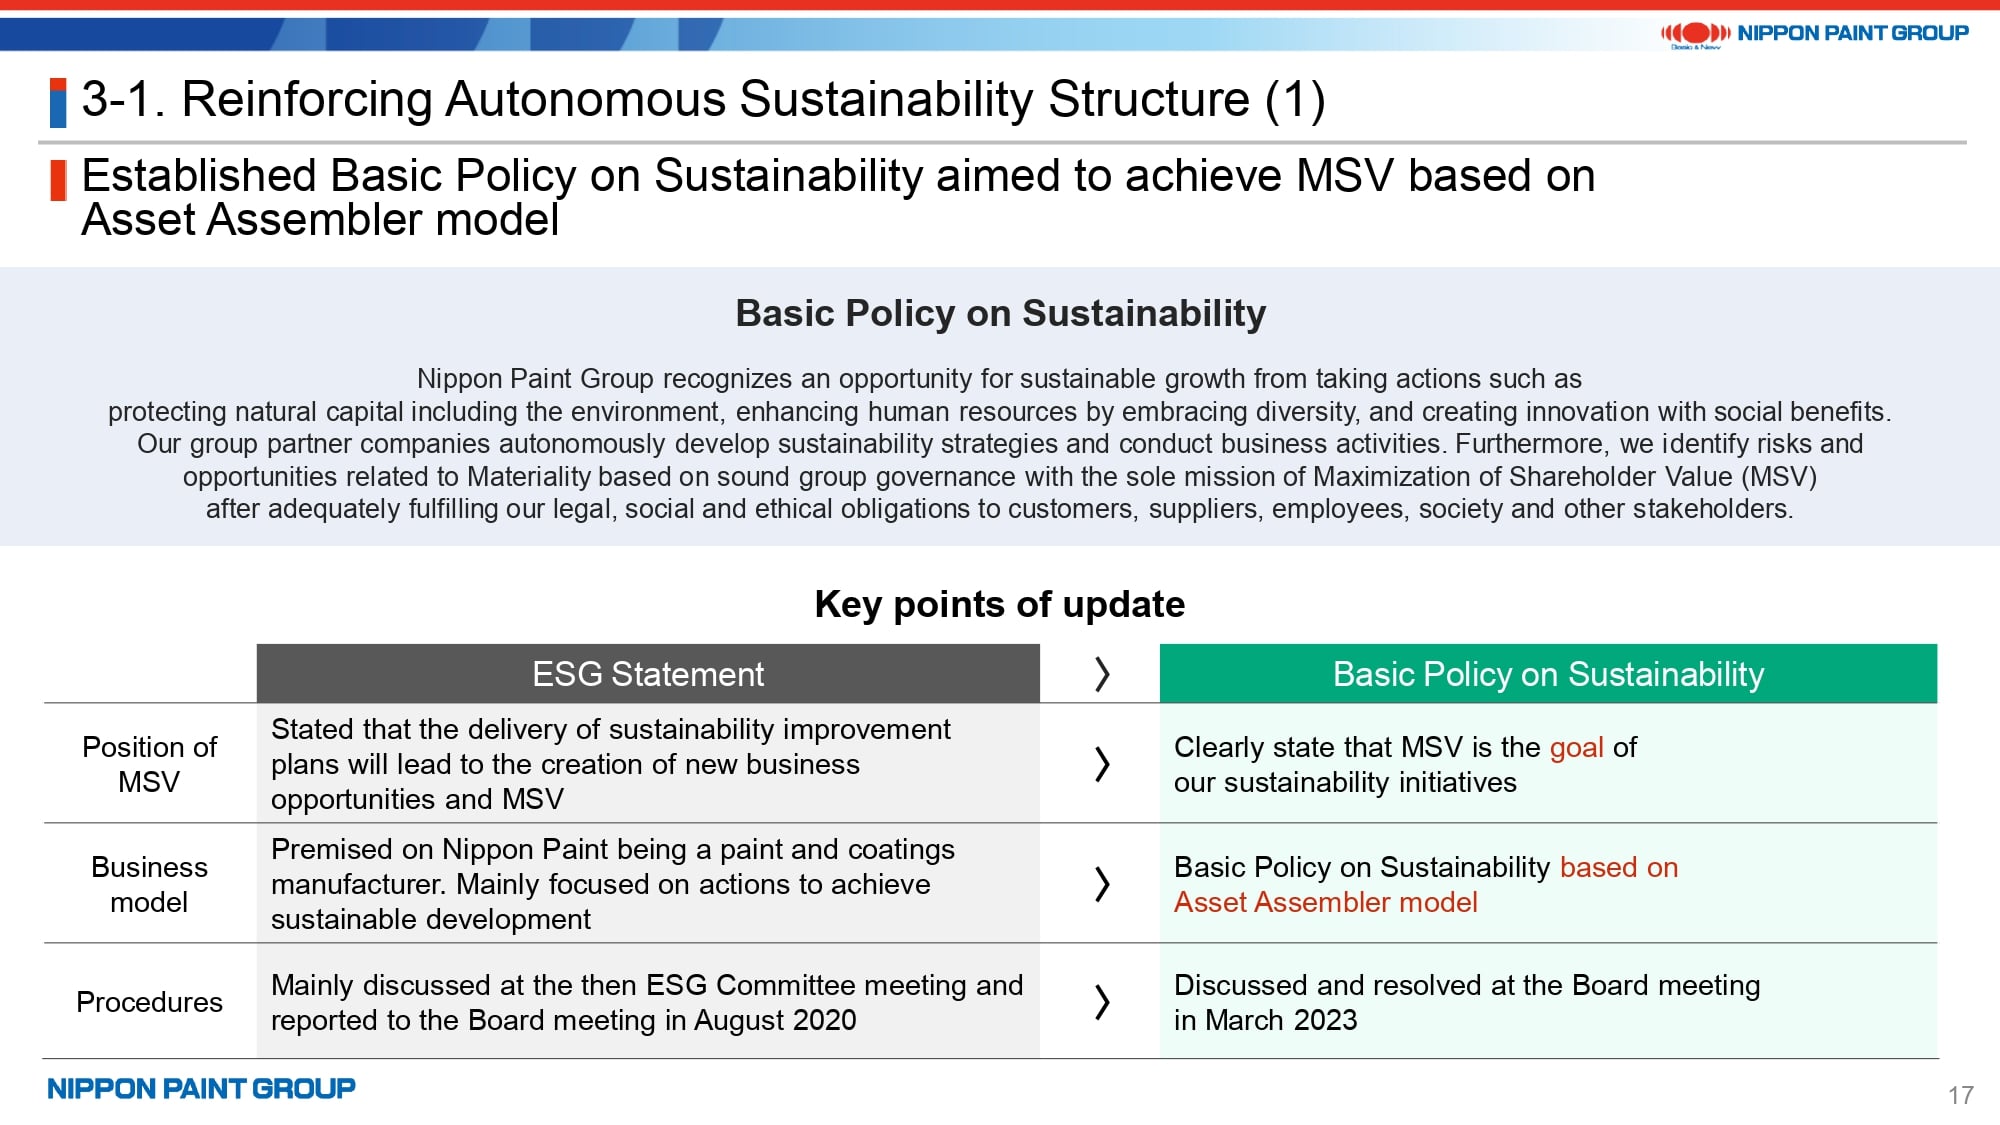
14. Reinforcing Autonomous Sustainability Structure (1)
This concludes the updates on each asset. The updates on our sustainability strategy start on page 17.
Firstly, the Basic Policy on Sustainability was approved by the Board of Directors to replace the existing ESG Statement. This policy clarified MSV as the goal of our sustainability initiatives. In addition, our sustainability initiatives are based on Asset Assembler model and are not based on a centralized, HQ-driven structure as I have stated in prior occasions. This basic policy embodies our approach to sustainability.
15. Reinforcing Autonomous Sustainability Structure (2)
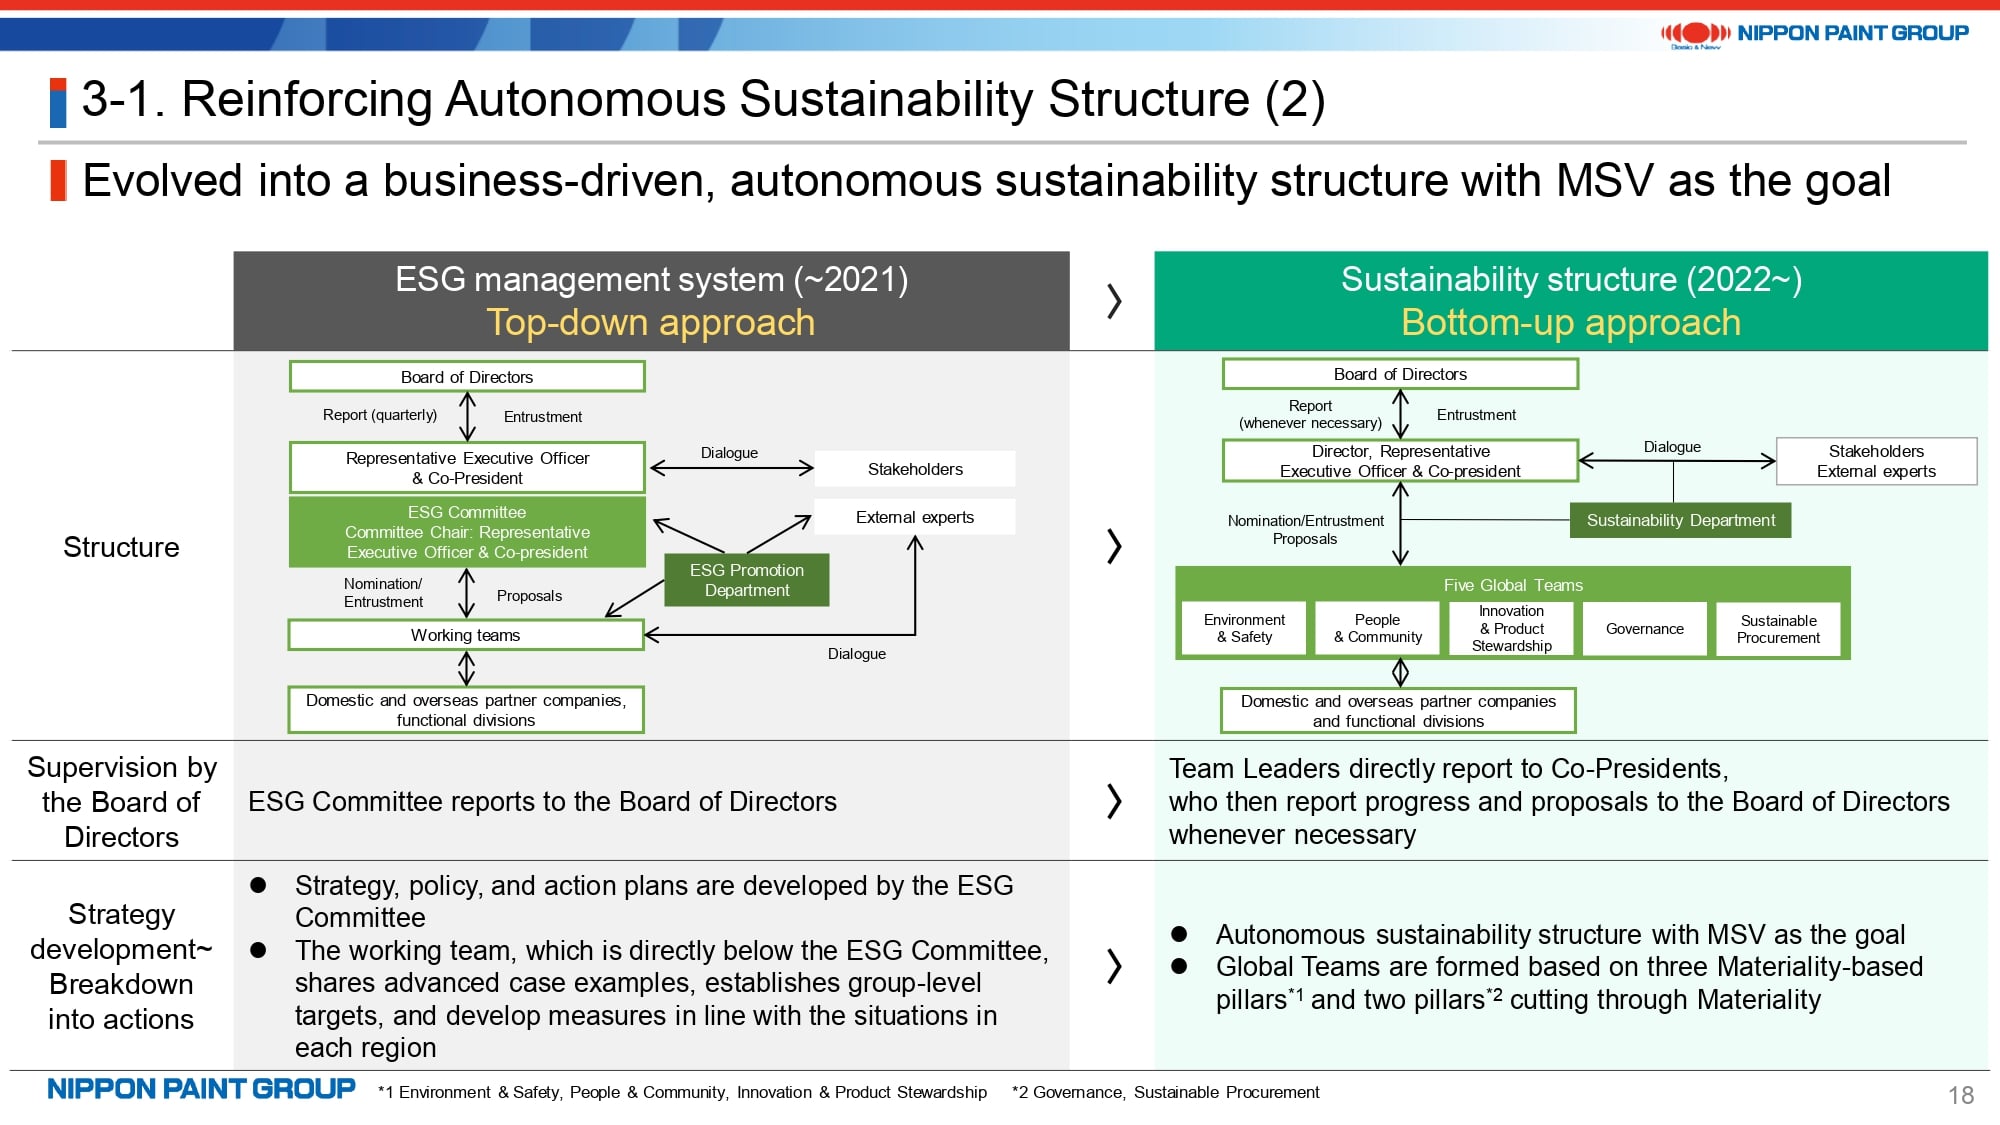
We have revised our sustainability structure as I have stated before. Specifically, we adopted a structure where initiatives are taken by management teams and business leaders of partner companies starting with FY2022. This is a change from the top-down, NPHD-led approach used in FY2021 and prior years. Sustainability Team Leaders, who were appointed from business leaders, coordinate agendas from a global perspective and report progress and proposals to the Co-Presidents roughly on a quarterly basis.
Page 19 shows the actions and initiatives of each Sustainability Team. Our sustainability goal is to fulfill our obligations to stakeholders, which is the premise for MSV and is directly linked to MSV. We will properly identify social trends to meet the requirements of society that change from time to time in terms of content and the extent of disclosure. I will not go into the details.
16. Sustainability Strategy Updates: ESG Index/Rating Evaluations
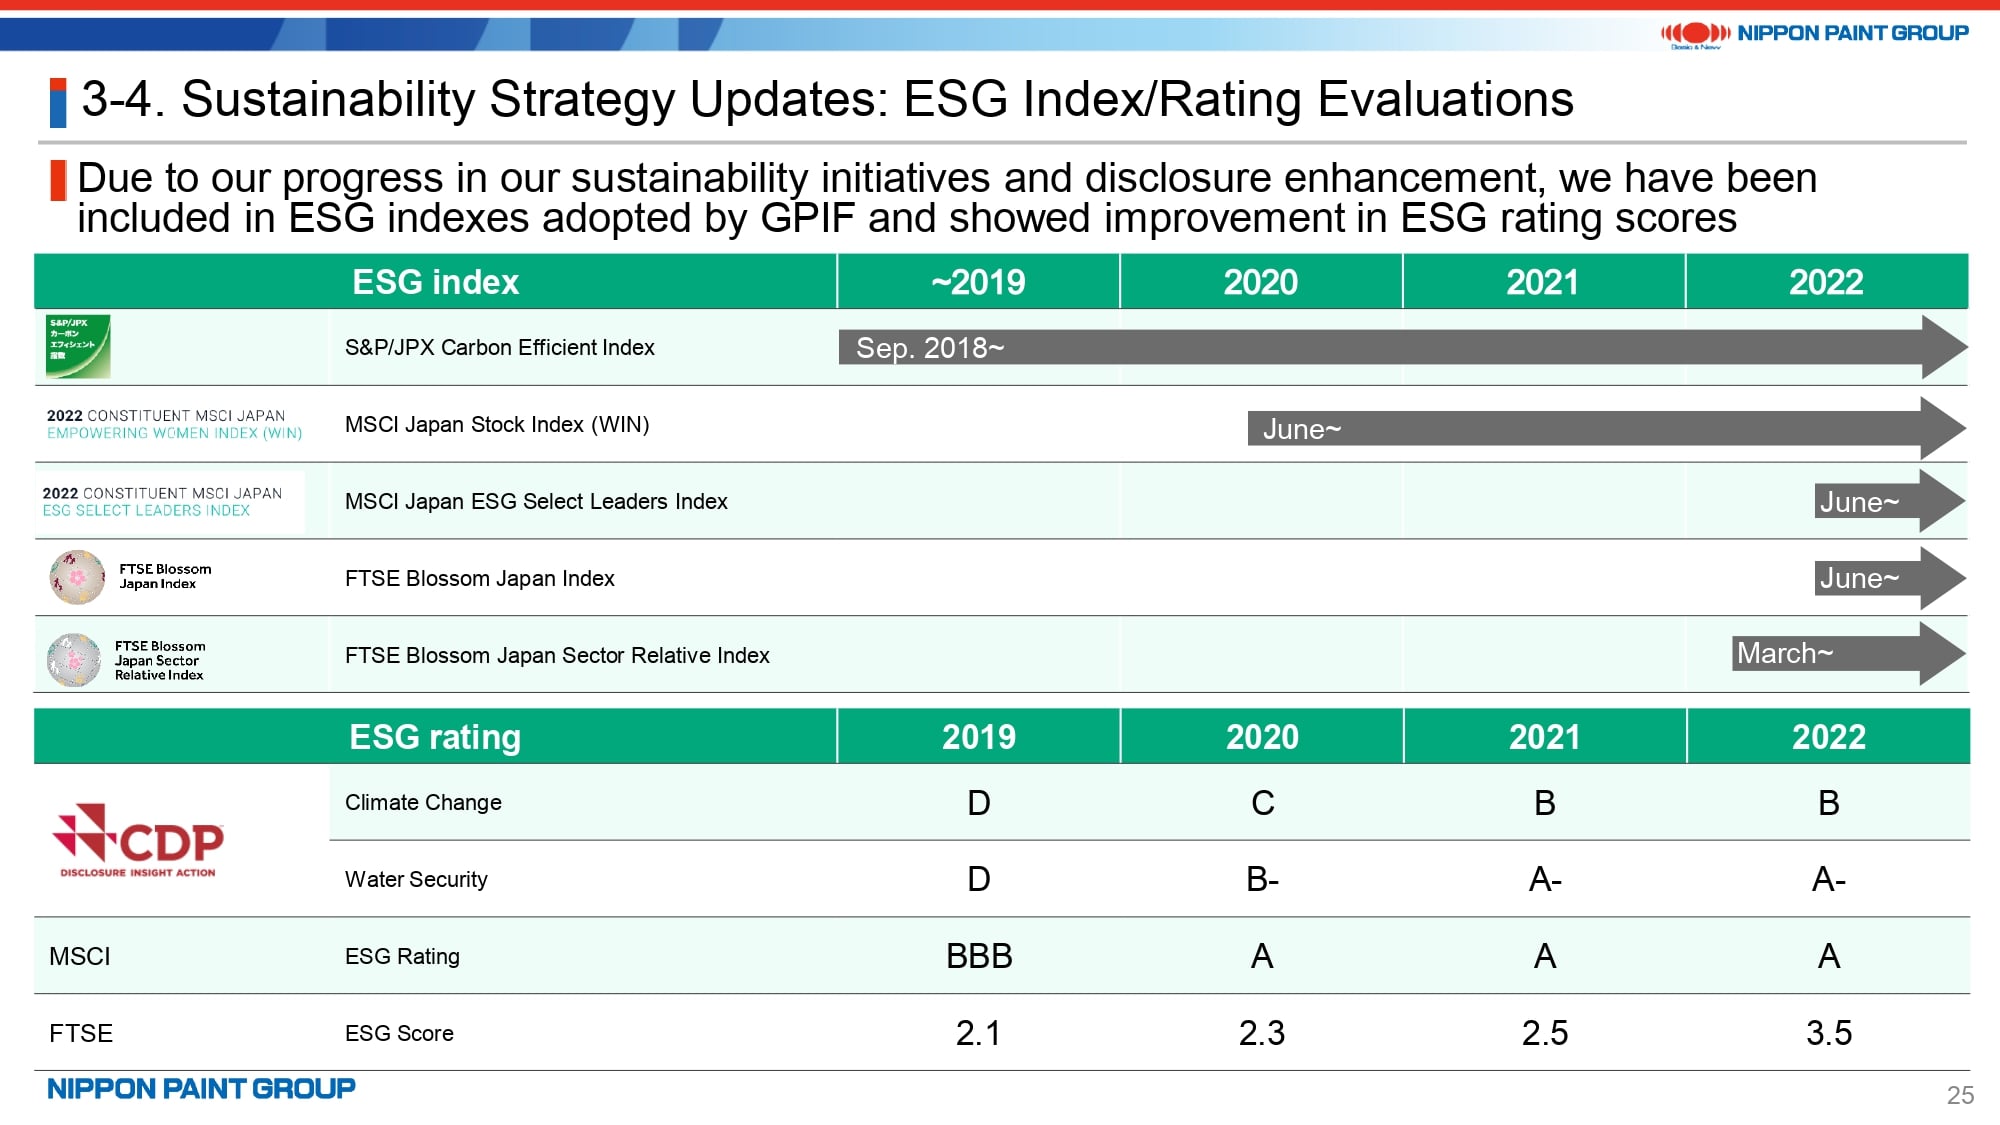
Page 25 shows that we have been included in all ESG indexes adopted by GPIF with an improvement in ESG rating scores owing to the progress of our sustainability initiatives and increased sustainability disclosures.
17. M&A Strategy
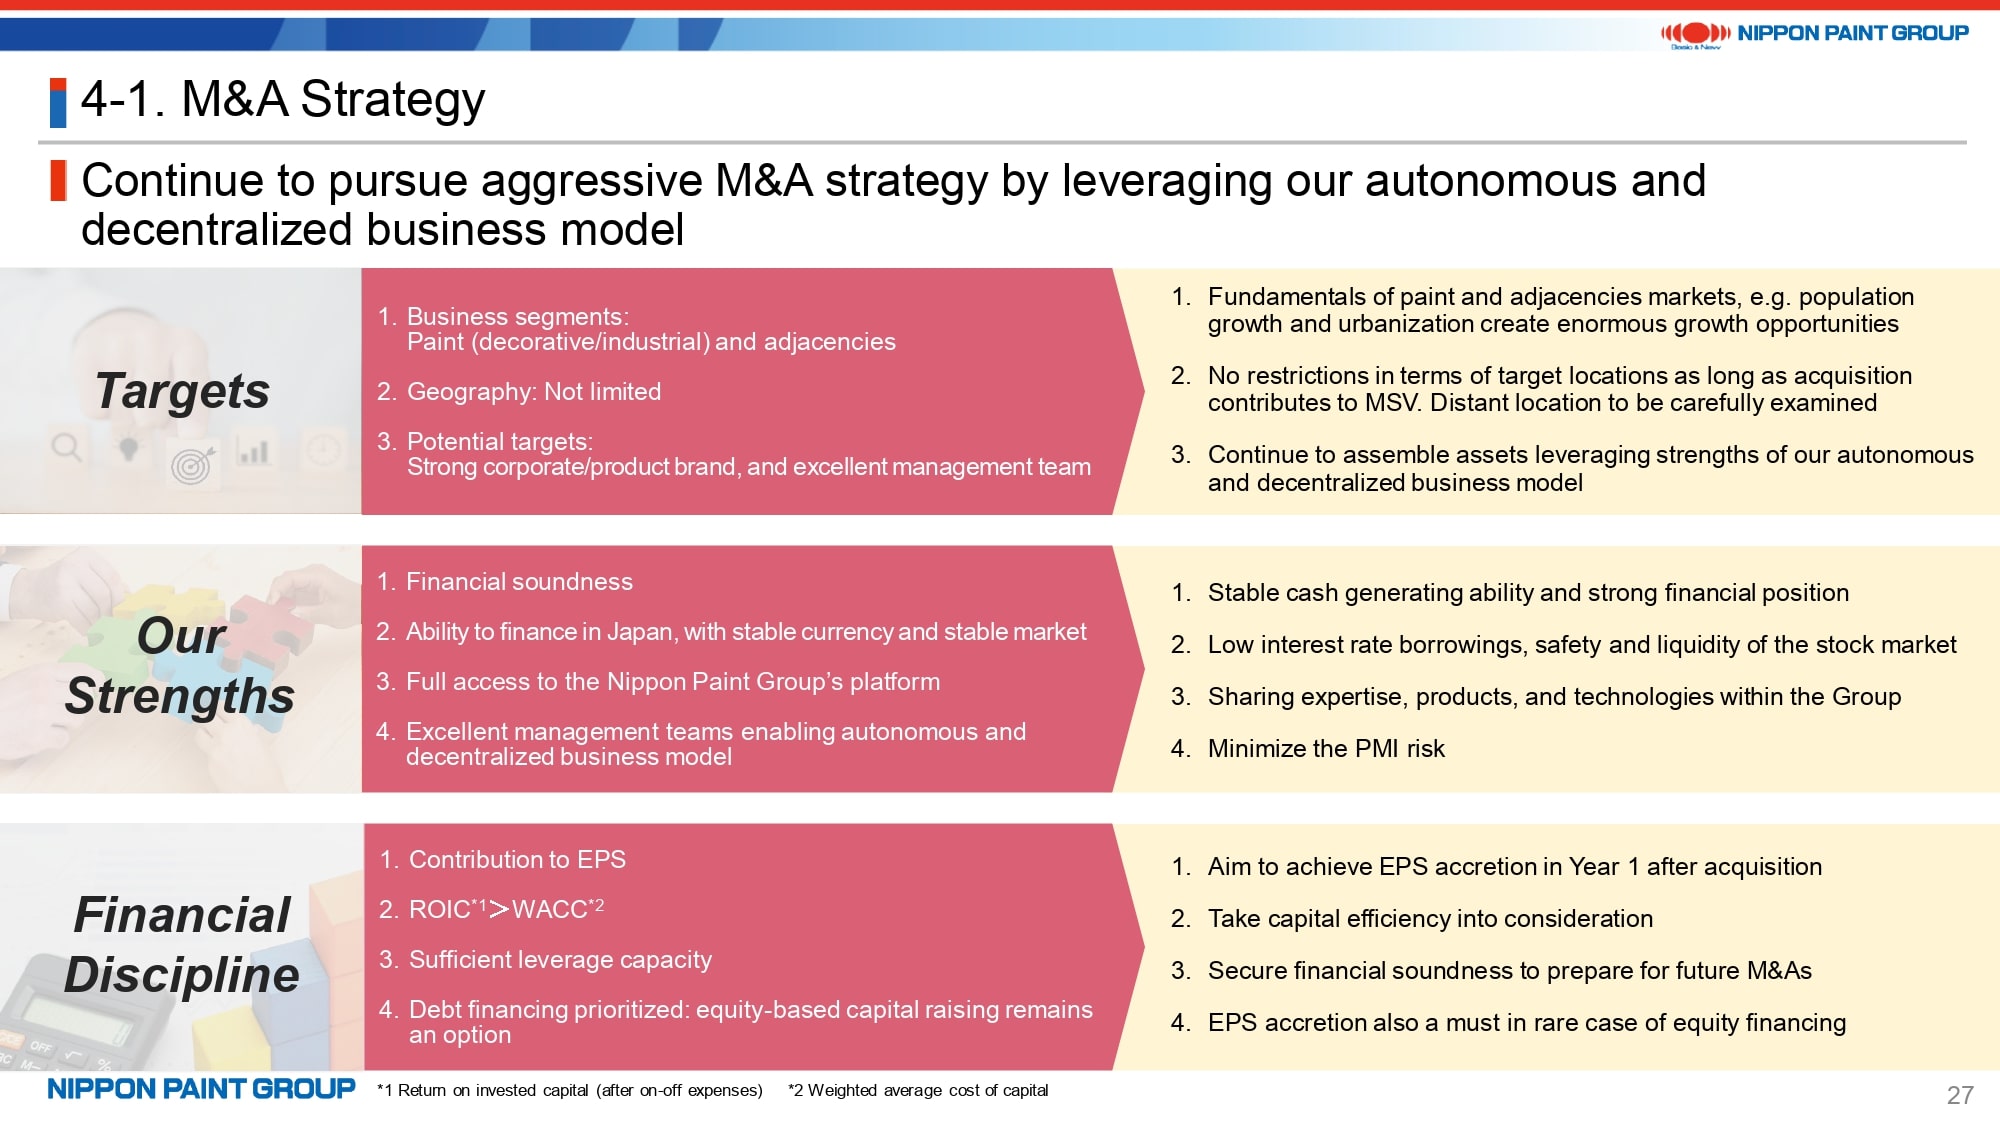
There is no significant change in the key elements of our M&A strategy. We will have MSV as the guiding axis when discussing our targets, strengths, and financial discipline.
18. M&A Success Case: DuluxGroup (1)
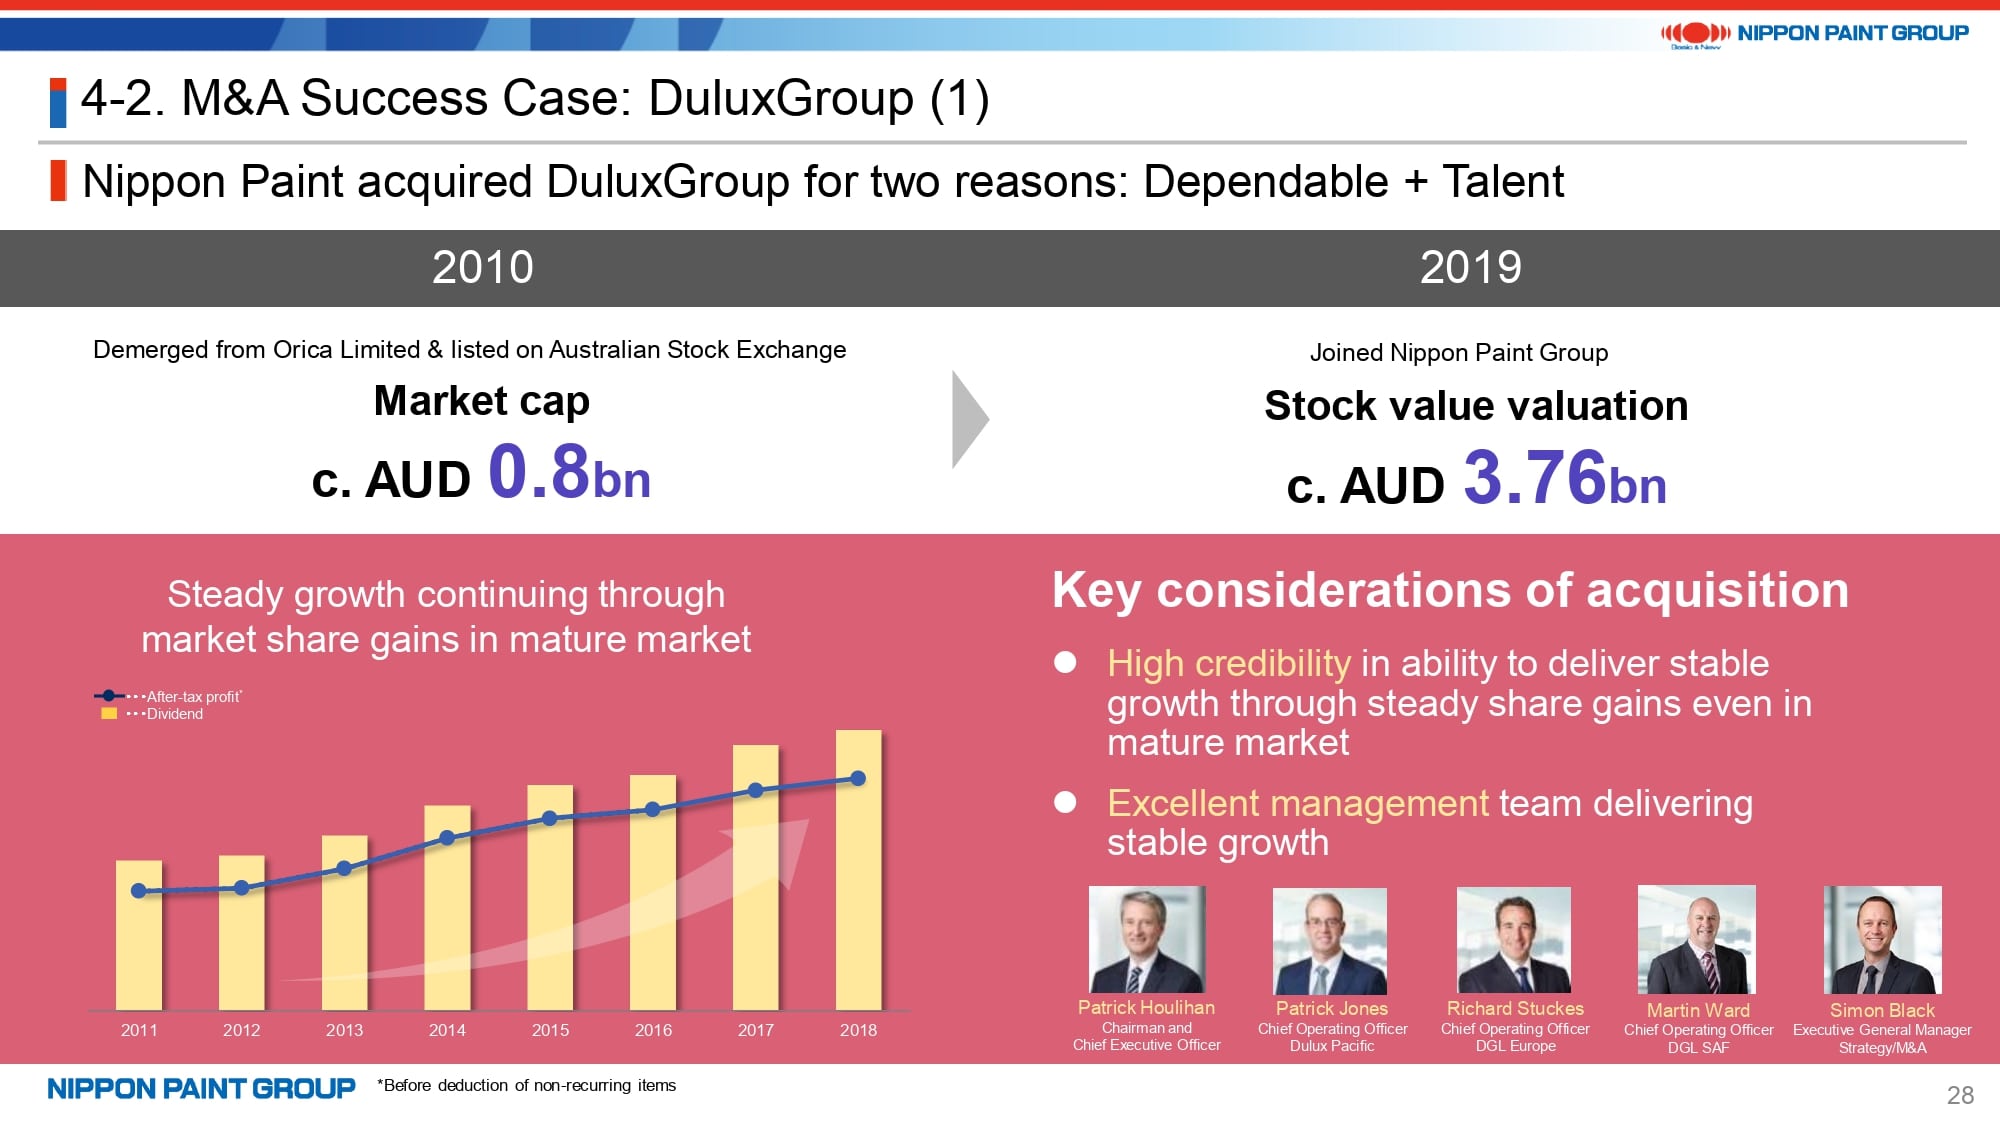
Now let me revisit our acquisition of DuluxGroup to showcase the success of our Asset Assembler model.
DuluxGroup has achieved steady growth since the company went public in 2010 following the spin-off from ORICA Limited, which was an Australian operation of the former ICI Group. In 2019, NPHD acquired DuluxGroup, a very dependable company, for AUD 3.76 bn along with its excellent management team led by Patrick Houlihan, who became CEO in 2007 and remains so today.
19. M&A Success Case: DuluxGroup (2)
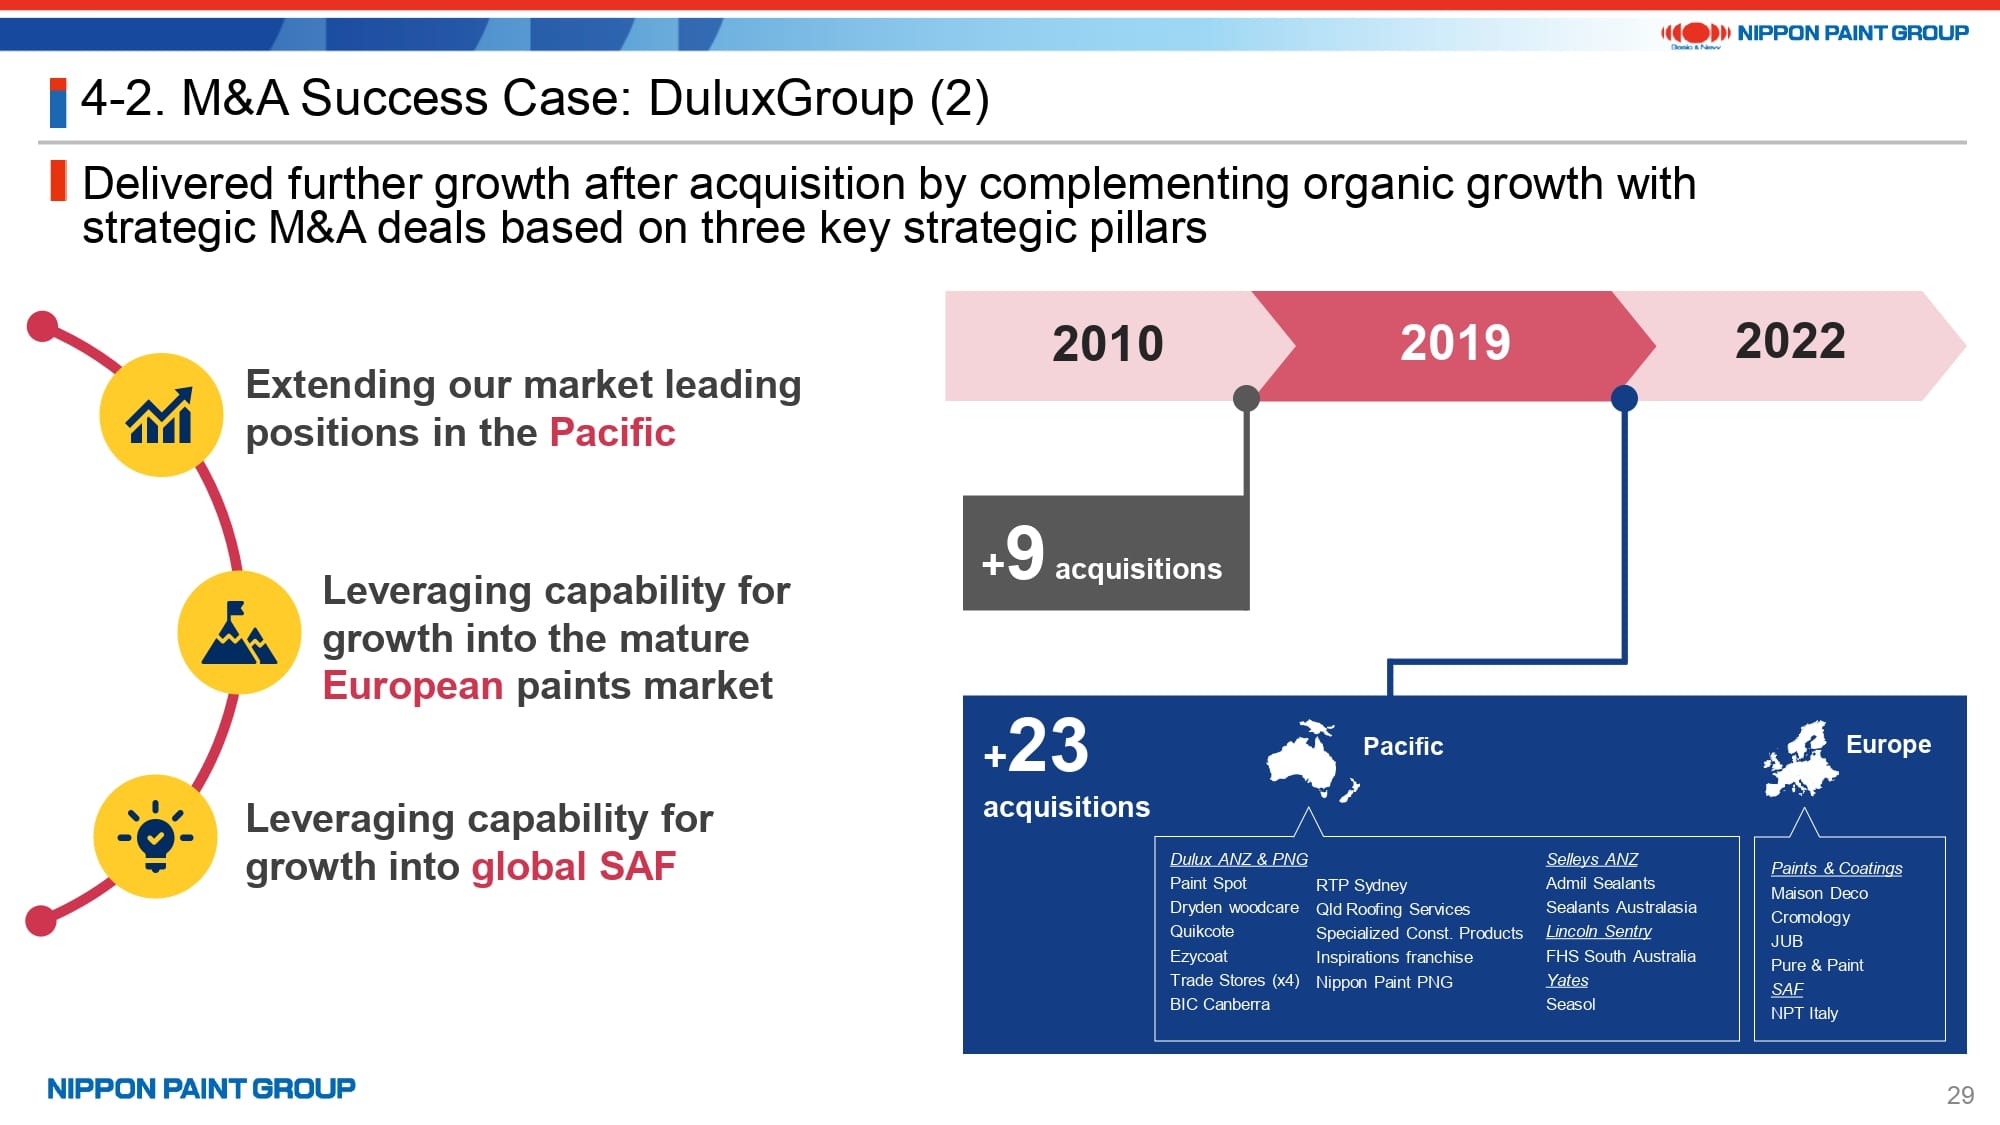
After the closing of the acquisition of DuluxGroup, CEO Houlihan asked Chairman Goh during their one-on-one meeting, “Now that DuluxGroup has joined the Nippon Paint Group, what would you want us to do?” Chairman Goh replied, “What’s important is not what I want you to do but what you want to do and why. If your ambition leads to MSV, NPHD will give you full support to make it come true.” This exemplifies our approach of respecting autonomy based on trust.
In response, the management team of DuluxGroup reexamined their growth strategy and set three key strategic pillars: extending market leading positions in the Pacific; leveraging capabilities for growth in the mature European paints market; and leveraging capabilities for growth in the global SAF (Sealants, Adhesives & Fillers) market. The number of M&A transactions carried out by DuluxGroup has increased dramatically from nine over nine years when the company was a public company to 23 in only three years since the company joined the Nippon Paint Group. As a result, DuluxGroup has grown to account for nearly a quarter of our Group in terms of revenue and operating profit. This demonstrates the success of M&A transactions that freed DuluxGroup from the need to worry about short-term stock price movements and enabled the company to realize its full potential by leveraging the financing capability of the huge platform of the Nippon Paint Group.
20. M&A Success Case: Adjacencies Business
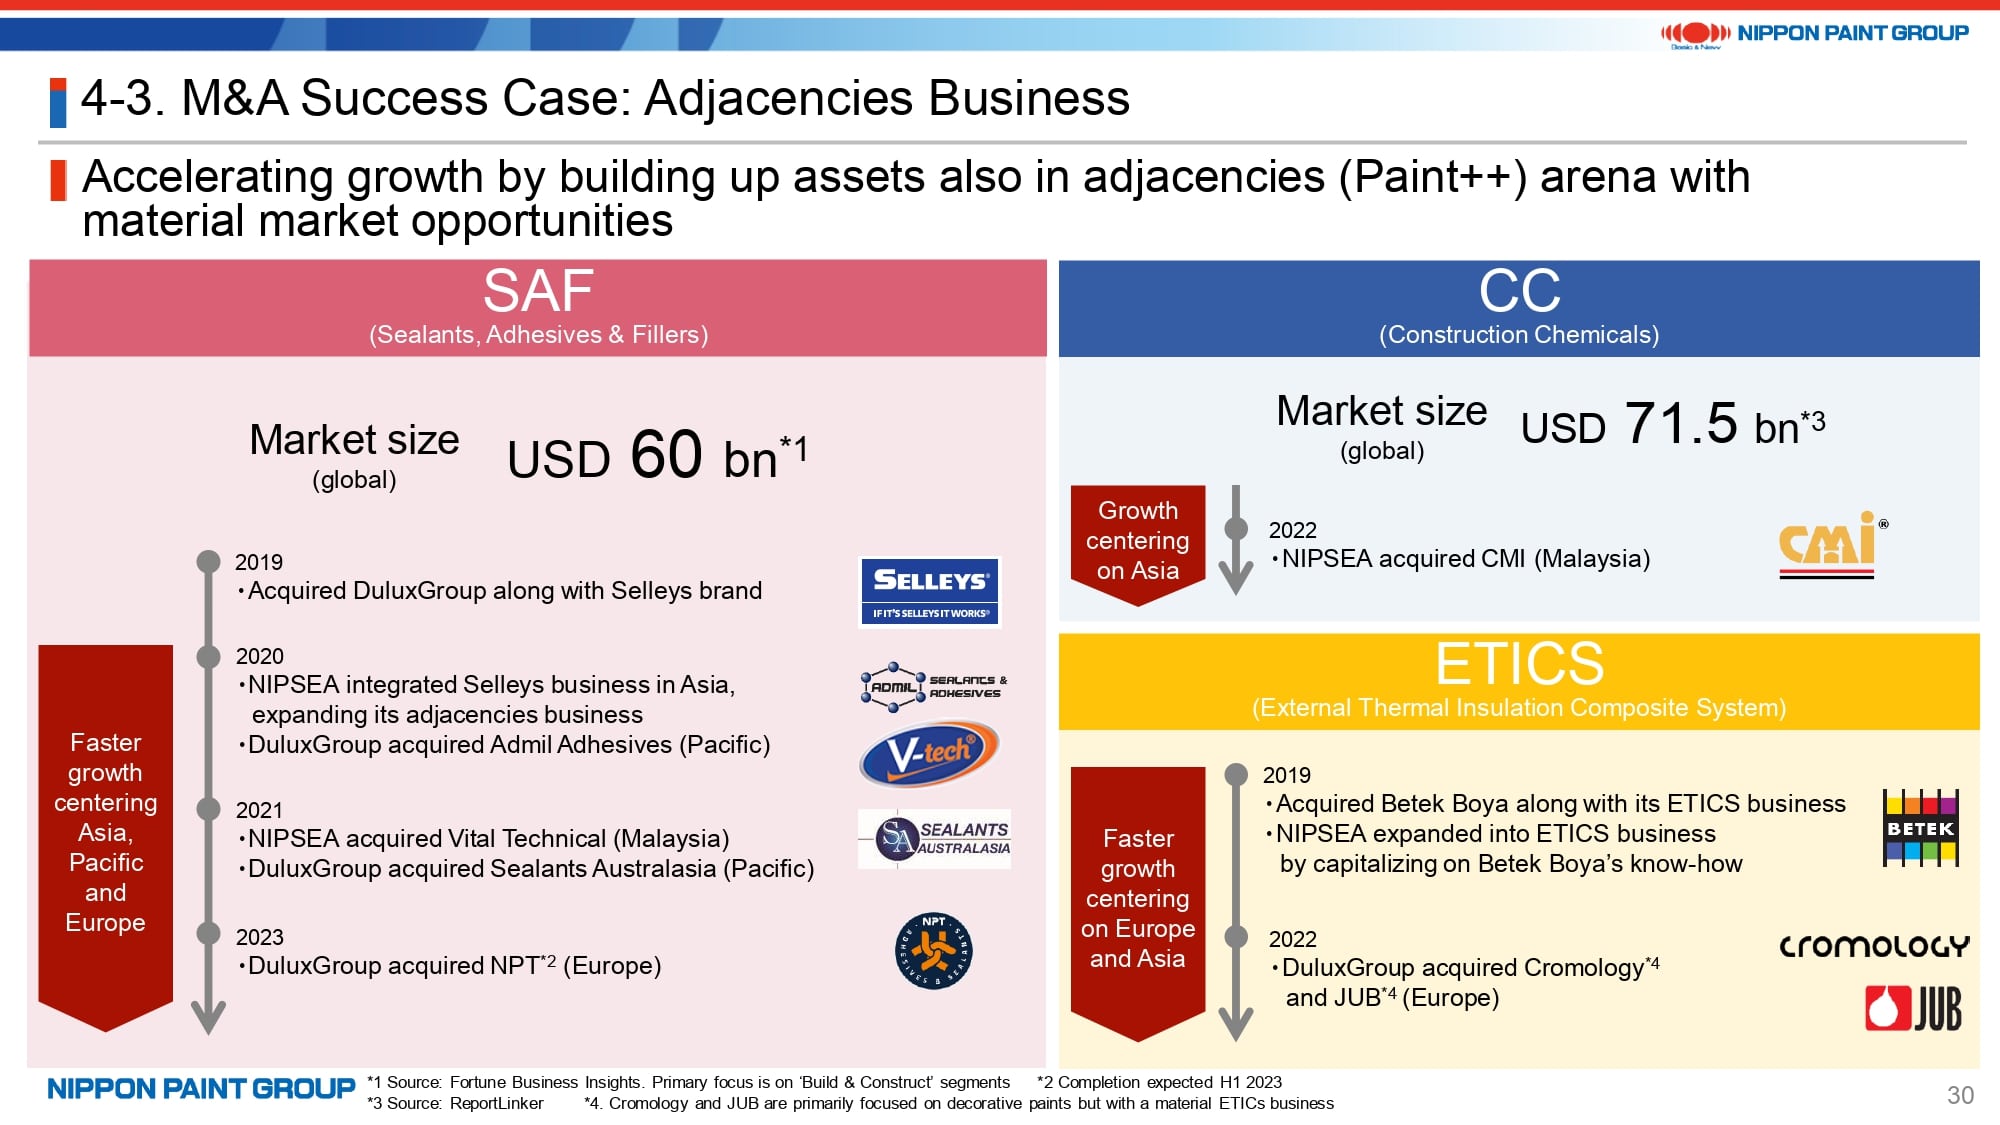
Our M&A transactions have opened up new opportunities, such as the additions of the SAF business through the acquisition of DuluxGroup, the ETICS (External Thermal Insulation Composite System) business through the acquisition of Betek Boya, and the CC (Construction Chemicals) business.
We aim to continue to build up excellent M&As that contribute to EPS accretion with limited risk.
21. Financial Strategy
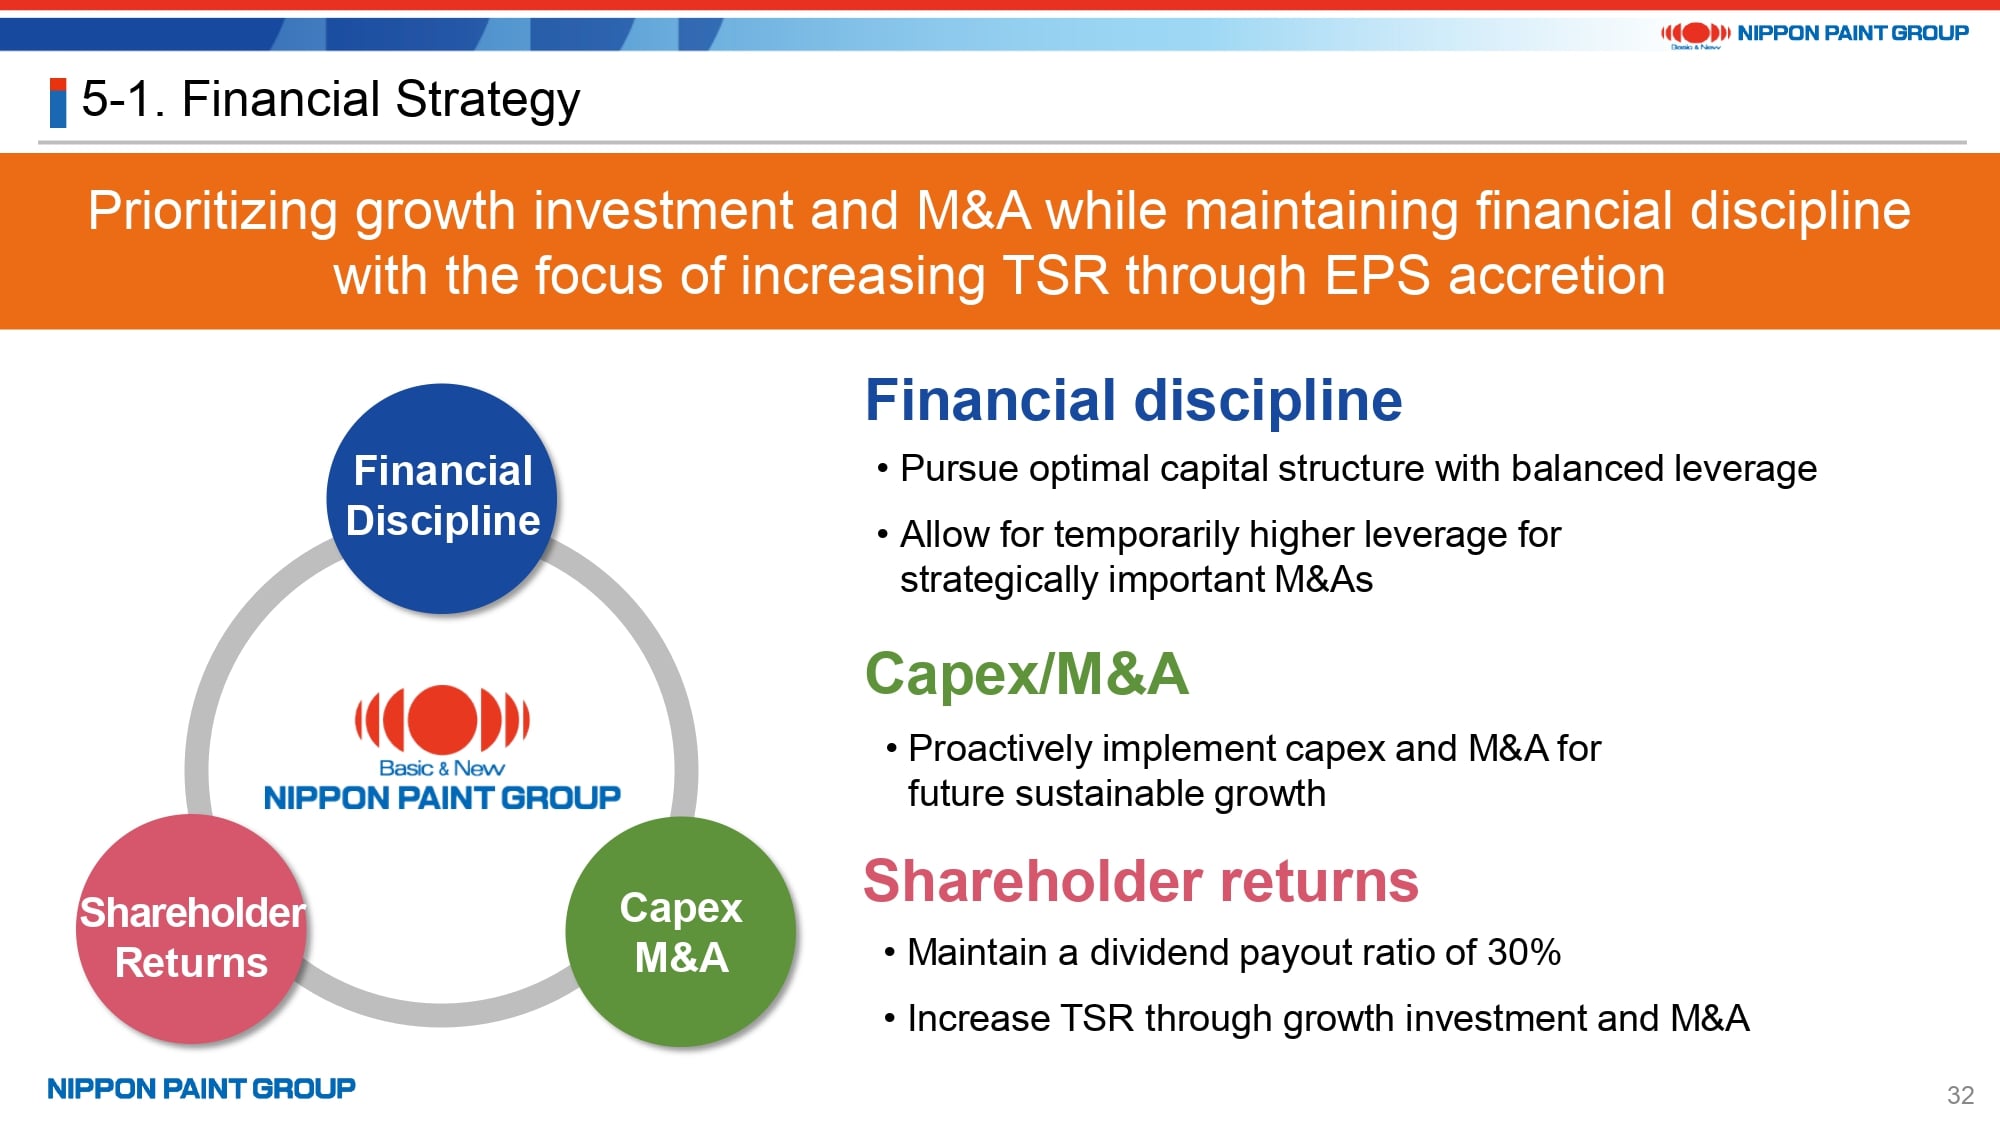
Regarding our financial strategy, there is no significant change in the key pillars underlying the strategy.
We will maintain an appropriate level of leverage and close communications with financial institutions and credit rating agencies.
We have received an inquiry about whether we will conduct share buybacks. Our judgment at this time is that prioritizing growth investments centered on M&A as a capital allocation strategy will generate higher returns. That’s not to deny the possibility of share buybacks but its priority is lower. I would like to add that we will maintain a dividend payout ratio of 30%.
22. Financial Position
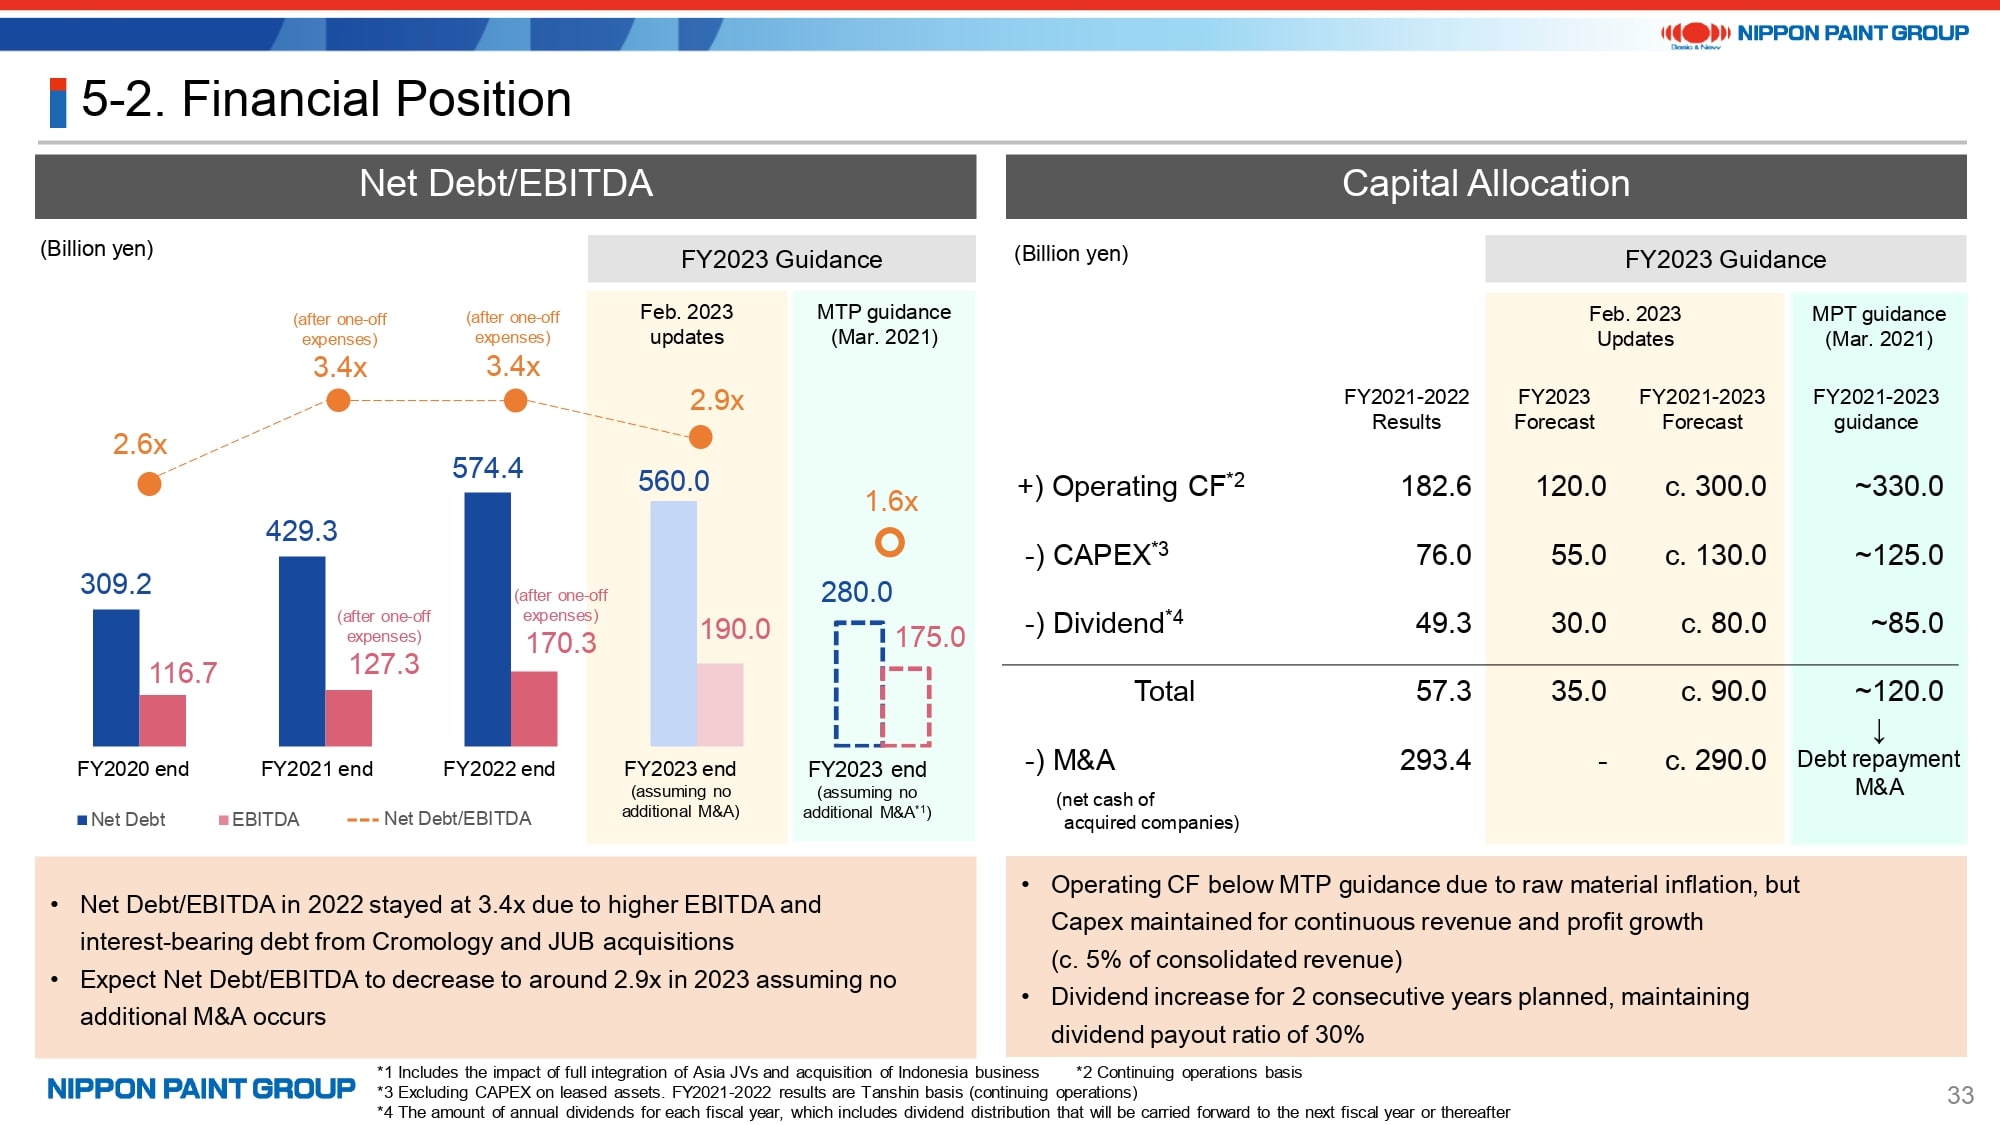
Based on our FY2023 guidance, Net Debt/EBITDA will decline to 2.9x assuming that no additional M&A occurs this year.
To explain the gap in capital allocation between the MTP guidance as of March 2021 and the FY2023 guidance as of February 2023, we expect operating cash flows during the three-year period from FY2021 to FY2023 to be around 30 bn lower than the MTP guidance as of March 2021. CAPEX and dividends are expected to be roughly in line with the MTP guidance. Adding the cash outflows of around 190 bn yen for M&A, excluding the acquisition of the Indonesia business, results in cash outflows of 220 bn yen.
23. Conclusion
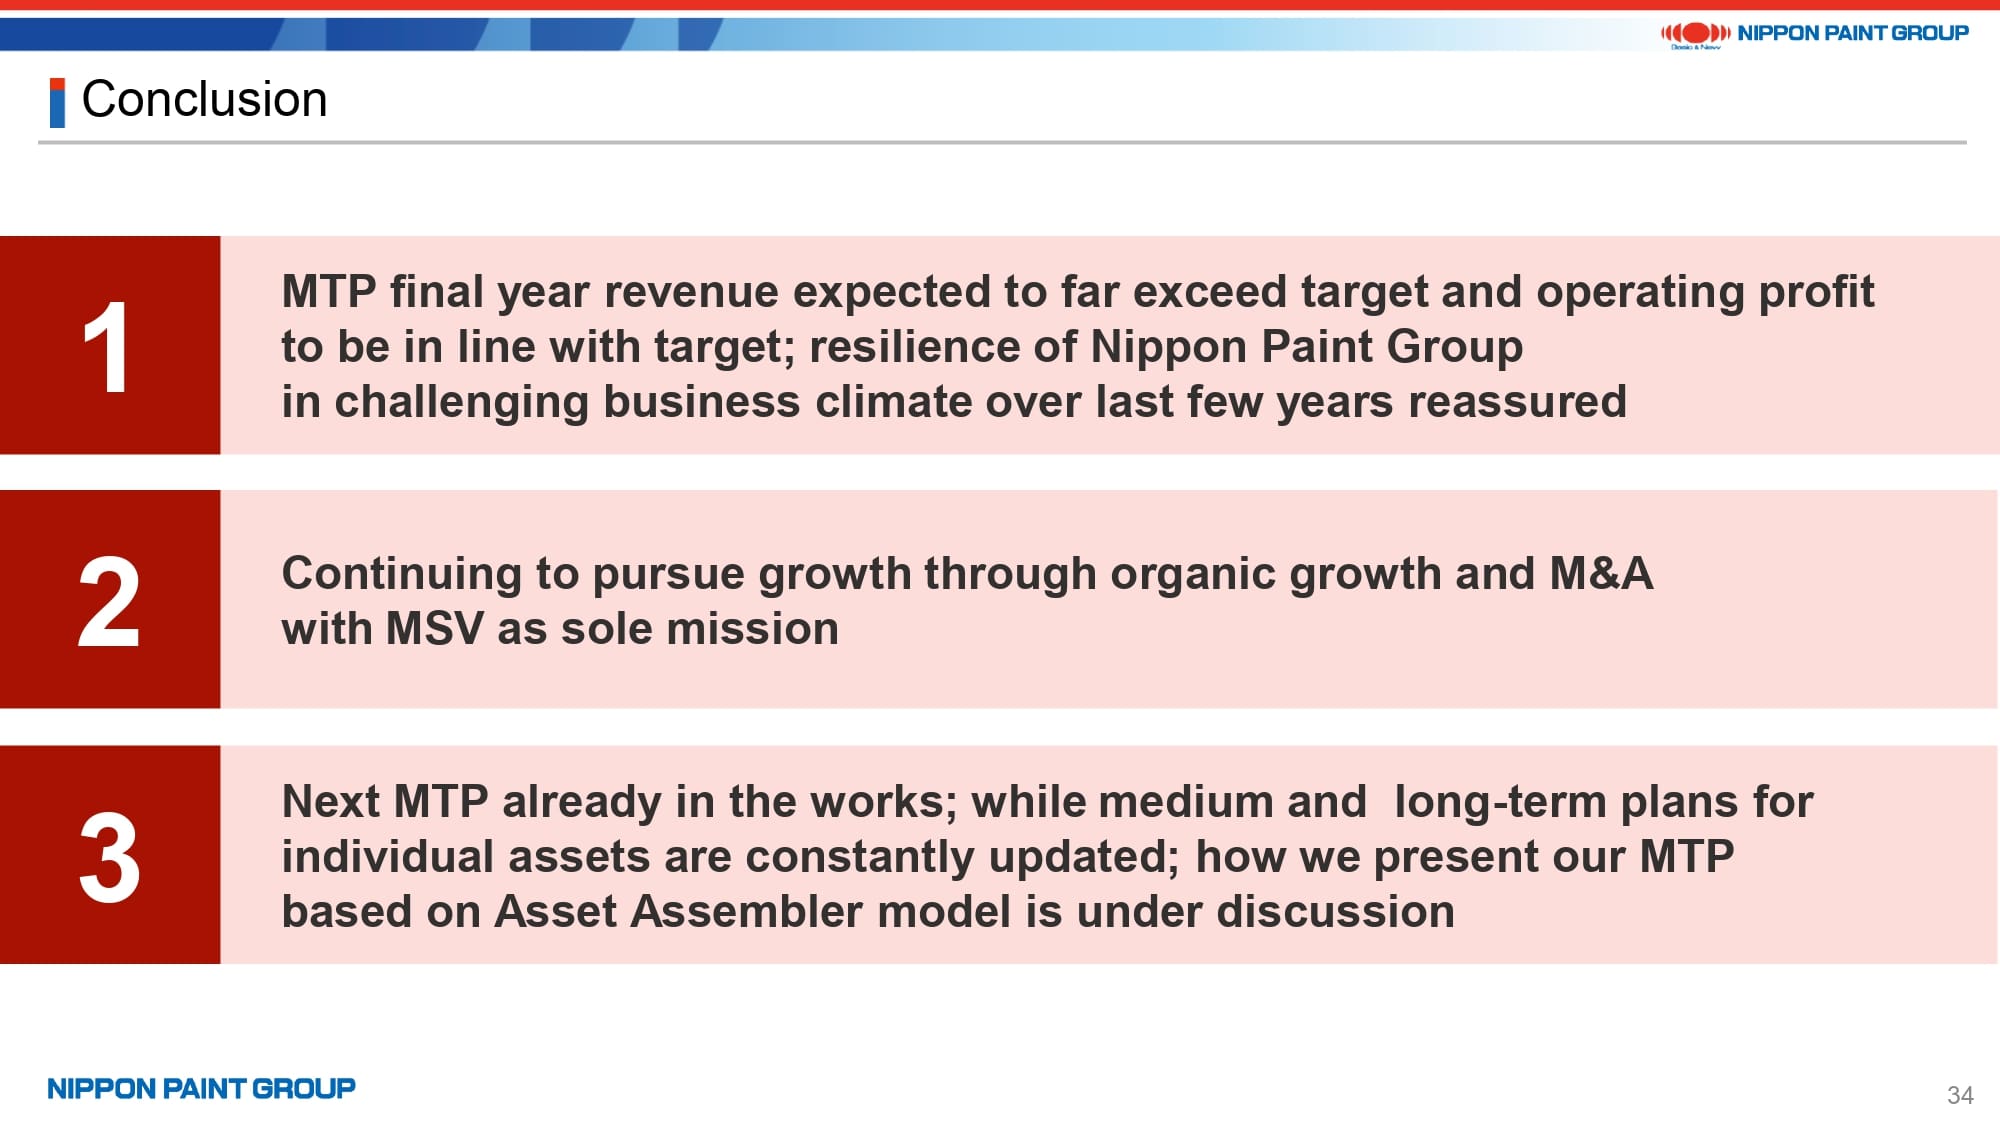
To wrap up today’s investor update meeting, the next MTP is already in the works. Many of our assets update their plans which they establish on a rolling basis looking three to four years ahead. How we present our MTP on a consolidated basis as an Asset Assembler is under discussion. I would appreciate feedback of investors to enhance our discussions regarding this subject.
Thank you for your attention.