Released February 13, 2026
No fundamental change to the Medium-Term Strategy launched in April 2024 and updated in April 2025; we remain committed, as an Asset Assembler, to pursuing unlimited upside through both organic and inorganic growth
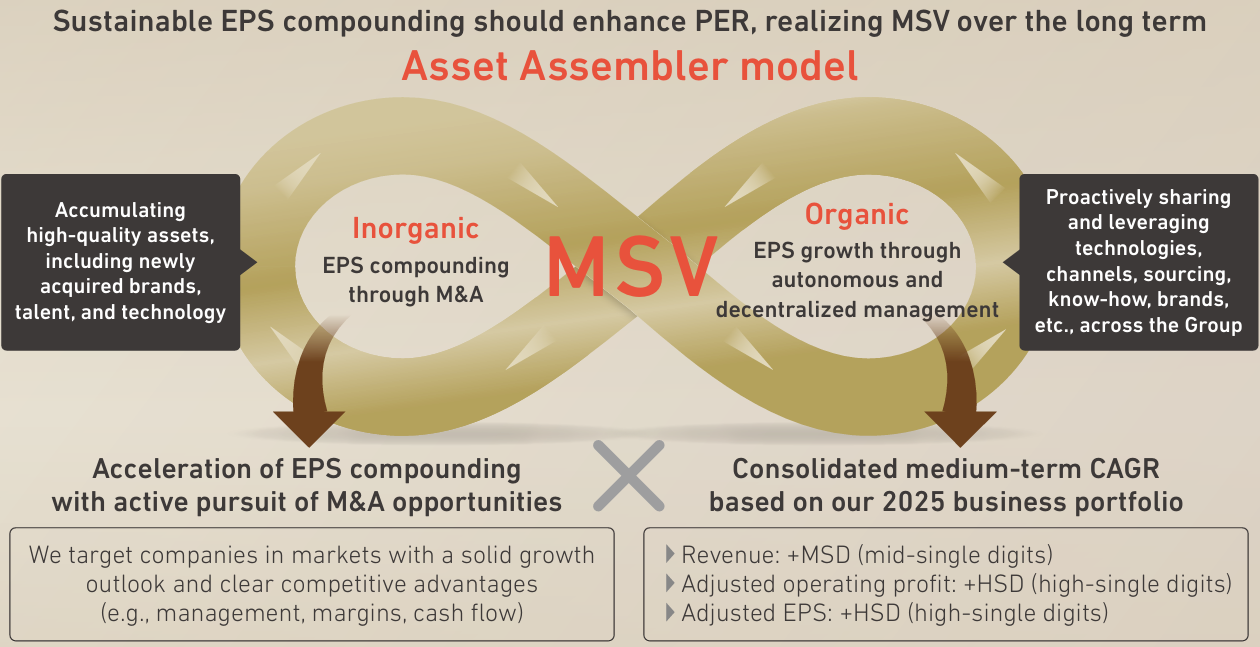
There is no fundamental change to the Medium-Term Strategy announced in April 2024 and updated in April 2025. We remain firmly committed to our Asset Assembler model, sustainably compounding EPS through the twin engines of organic and inorganic growth. By earning greater confidence from the capital markets in this track record, we aim to enhance PER and realize Maximization of Shareholder Value (MSV) over the long term.
At the same time, uncertainty surrounding the global economy and market environment has increased compared with 2024. In addition, AOC—whose operations are centered on the United States, where near-term conditions remain challenging—has joined our portfolio. Against this backdrop, we have updated our medium-term targets based on our 2025 business portfolio.
Progress Against the Medium-Term Targets Established in April 2024
When we announced the strategy in April 2024, our medium-term consolidated CAGR targets—based on the 2023 business portfolio and not assuming the acquisition of AOC—were revenue growth of 8–9% and EPS growth of 10–12%. From 2023 to 2025, on an organic basis excluding AOC, revenue grew by just under 7% and adjusted EPS by slightly above 10%, broadly in line with our initial expectations despite significant changes in the political and economic environment.
Including AOC’s contribution to consolidated results, revenue CAGR from 2023 to 2025 was 10.9%, while adjusted EPS CAGR was 22.0%. Compared with 2023, margins and cash generation have improved, and our business mix has evolved into a more balanced portfolio.
| Consolidated Basis | 2023 | 2024 | 2025*1 |
2023–2025 CAGR (Excluding AOC) |
2023–2025 CAGR (Including AOC) |
|---|---|---|---|---|---|
| Revenue (JPY 100 million) | 14,426 | 16,387 | 17,742 |
5.9% (6.7%)*2 |
10.9% |
| Operating Profit (JPY 100 million) | 1,687 | 1,862 | 2,571 | 11.2% | 23.4% |
| Operating Profit Margin | 11.7% | 11.4% | 14.5% | — | — |
| Adjusted Operating Profit (JPY 100 million) | 1,815 | 1,996 | 2,742 | 10.4% | 22.9% |
| Adjusted Operating Profit Margin | 12.6% | 12.2% | 15.5% | — | — |
| Adjusted EPS (JPY) | 57.6 | 60.4 | 85.8 | 10.3% | 22.0% |
| EPS (JPY) | 50.4 | 53.6 | 76.7 | 9.8% | 23.3% |
*1 Following the finalization of AOC’s PPA, 2025 figures have been retrospectively revised. Pro forma figures are presented.
*2 Assuming that the change in the agent model for the trading business in NIPSEA China’s decorative business had been implemented in 2023
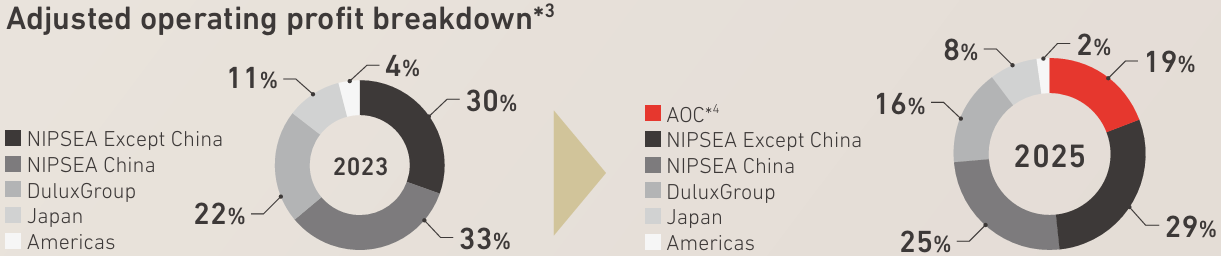
Adjusted Operating Profit Composition
*1 Following the finalization of AOC’s PPA, 2025 figures have been retrospectively revised. Pro forma figures are presented.
*2 Assuming that the change in the agent model for the trading business in NIPSEA China’s decorative business had been implemented in 2023
*3 Ratio to the simple sum of segment profit *4 10-month earnings
Organic
Continuing Strong Profit Growth Despite a Challenging Market Environment
Compared with the environment in April 2024, global economic momentum weakened, including lower GDP growth in developed markets, and the paint market was affected to some extent. Against this backdrop, NIPSEA Except China drove growth from 2023 to 2025, delivering a 20.7% CAGR in adjusted operating profit. NIPSEA China, Japan, and DuluxGroup also achieved solid profit growth, resulting in strong organic growth even excluding AOC’s consolidation effect.
Going forward, we will pursue both revenue growth and margin improvement through strategy execution tailored to the opportunities in each region and business. We expect adjusted operating profit CAGR of MSD to DD across the respective segments.
Growth Forecast by Asset
| Segment | Our Medium-Term Growth | |||||||
|---|---|---|---|---|---|---|---|---|
|
2024 Forecast (in LCY) |
2023–2025 Actual |
Current Medium-Term Forecast (in LCY) |
||||||
|
Revenue CAGR |
OP Margin (vs. 2023)*1 |
Revenue CAGR |
Adjusted Operating Profit CAGR |
Adjusted Operating Profit Margin (2025) |
Revenue CAGR |
Adjusted Operating Profit CAGR |
Adjusted Operating Profit Margin (vs. 2025)*1 |
|
| Japan | +0–5% |
↗ (2023: 9.5%) |
+1.0% | +6.3% | 10.7% | +LSD | +MSD | ↗ |
| NIPSEA China | c. +10% |
→ (2023: 12.5%) |
-1.3%*2 (+1.1%)*2 |
+5.9% | 14.7% | +MSD | +MSD | → |
|
NIPSEA Except China |
+15–20% |
→ (2023: 17.4%) |
+20.1% | +20.7% | 19.6% | +HSD | +HSD | → |
| DuluxGroup | c. +5% |
→ (2023: 9.6%) |
+6.0% | +6.1% | 11.1% | +MSD | +DD | ↑ |
| AOC | — | — | — | — | 33.7%*3 | +MSD | +MSD | ↗ |
*1 ↑: ≥+2%, ↗: +1%–+2%, →: -1%–+1%, ↘: -1%–-2%, ↓: ≤-2%
*2 +1.1% assuming that the change in the agent model for the trading business in NIPSEA China’s decorative business had been implemented in 2023
*3 10-month earnings
Inorganic
Accelerating EPS Compounding Through Disciplined M&A
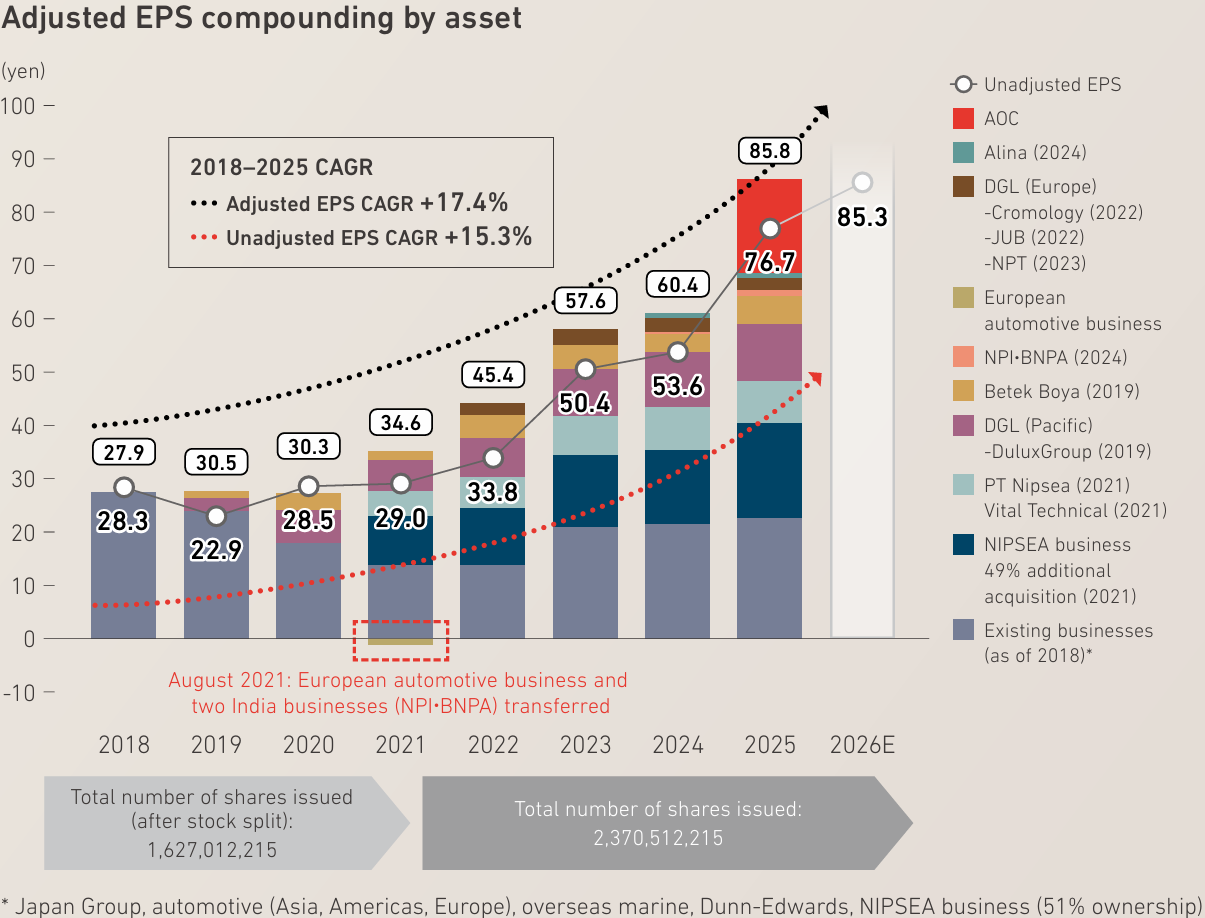
Amid uncertainty in the macroeconomic environment and a broad decline in valuation multiples, market conditions are becoming more conducive to acquiring high-quality assets at reasonable valuations. Since 2018, we have significantly compounded EPS by combining organic growth and M&A, while also working to improve returns through higher ROIC at each asset.
AOC delivered the expected EPS contribution from the first year following acquisition and continues to maintain high margins and a strong profit contribution. Our reported EPS forecast for 2026 is JPY85.3, up 11.4% year on year, while adjusted EPS is also expected to increase by approximately 10%. Adjusted EPS CAGR from 2018 to 2026 is projected to be approximately 16%.