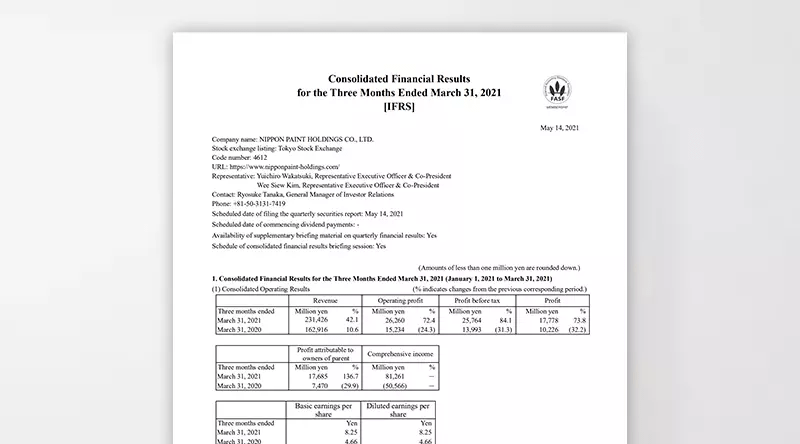
Latest Results and Forecast
Earnings Forecast
<FY2025 Forecast> *Announced on April 3, 2025
The consolidation of AOC, as announced on March 4, 2025, in the “Notice Regarding Completion of Acquisition of AOC, a Global Specialty Formulator,” along with other factors—such as the divestiture of certain property, plant and equipment and changes in exchange rate assumptions—has led us to expect that our revenue, operating profit, profit before tax, and profit attributable to owners of parent will exceed the previously announced guidance. Accordingly, we have decided to upwardly revise our guidance.
(Billion yen)
| Tanshin | 2022 Results |
2023 Results |
2024 Results |
2025 Forecast | |||
|---|---|---|---|---|---|---|---|
| Feb. guidance |
Apr. guidance |
Change guidance |
YoY guidance |
||||
| Revenue | 1,309 | 1,442.6 | 1,638.7 | 1,740.0 | 1,820.0 | +4.6% | +11.1% |
| Operating profit | 111.9 | 168.7 | 187.6 | 198.0 | 244.0 | +23.2% | +30.1% |
| OP margin | 8.5% | 11.7% | 11.5% | 11.4% | 13.4% | +200 bps | +190 bps |
| Profit before tax | 104.5 | 161.5 | 181.5 | 188.0 | 226.0 | +20.2% | +24.5% |
| Profit*1 | 79.4 | 118.5 | 127.3 | 134.0 | 162.0 | +20.9% | +27.2% |
| EPS | ¥33.82 | ¥50.45 | ¥54.22 | ¥57.05 | ¥69.0 | +20.9% | +27.2% |
*1: Profit in FY2022 is profit attributable to owners of parent from continuing operations. Profit in FY2023, 2024 and Profit forecast for 2025 is profit attributable to owners of parent.
Assumptions for FY2025 Forecast *Announced on February 14, 2025
(Billion yen)
| Revenue | OP margin | ||||
|---|---|---|---|---|---|
| FY2024 Results (Tanshin/bn yen) |
FY2025 Forecast (In LCY*1) |
FY2024 Results (Tanshin/%) |
FY2025 Forecast*2 (In LCY*1) |
||
| Japan | Segment total | 203.1 | +5 - 10% | 9.6% |
 |
| Automotive | 39.2 | +0 - 5% | |||
| Decorative | 48.4 | c.+10% | |||
| Industrial | 39.5 | c.+10% | |||
| NIPSEA China |
Segment total | 545.2 | c.±0% | 11.1% |
 |
| Decorative(TUC) | 459.7*2 | c.+10% | |||
| Decorative(TUB) | c.+5% | ||||
| Automotive | 56.6 | c.+10% | |||
| NIPSEA Except China |
Segment total | 369.2 | +5 - 10% | 17.2% |
 |
| Malaysia Grp. Singapore Grp. Thailand Grp. |
+5 - 10% |
|
|||
| PT Nipsea (Indonesia) |
65.0 | +5 - 10% | 34.9% |
|
|
| Betek Boya (Türkiye) |
95.0 | +5 - 10% | 13.2% |
 |
|
| NPI・BNPA (India) |
(For reference) 45.5*3 |
+5 - 10% | (For reference) 4.2%*3 |
|
|
| Alina (Kazakhstan) |
25.8 | +5 - 10% | 13.2% |
|
|
| DuluxGroup | Segment total | 398.5 | c.+5% | 10.1% |
|
| DGL (Pacific) |
248.8 | c.+5% | 13.3% |
|
|
| DGL (Europe) |
149.8 | c.+5% | 4.9% |
|
|
| Americas | Segment total | 122.7 | c.+5% | 6.3% |
|
| Automotive | 45.5 | +0 - 5% | |||
| Decorative | 75.0 | +5 - 10% | |||
◆To better reflect our business evolvement, we have reorganized our China decorative business into TUC and TUB (based on distribution channels) which will be applied to FY2023 forecast and onwards
- TUC (Trade Use Consumer): B2C
Business to consumers, DIY business, sales via dealers/distributors and e-commerce to end consumers, etc.
(For reference) 2022 vs. 2021: +10%- TUB (Trade Use Business): B2B
Business to business transactions direct to Project customers and main contractors, etc.
(For reference) 2022 vs. 2021: -14%- Others: Wood coatings, China Hong Kong and China Taiwan businesses, sales of raw materials
(For reference) 2022 vs. 2021: +102%
*1  ≧+2%,
≧+2%,  +1~2%,
  -1 - +1%,
  -1 - ー2%,
  ≦-2%
≦-2%
*2 Including “Other”
*3 1INR= JPY1.79; Pro-forma (unaudited)