
Font Size
1. Front Cover
Good afternoon. I’m Yuichiro Wakatsuki, Co-President of Nippon Paint Holdings.
Thank you very much for taking the time to join us today as we review our financial results for the second quarter of 2025.
Members of the press are also present with us today.
2. FY2025 2Q Operating Results: Achieved Record-High Revenue and Operating Profit
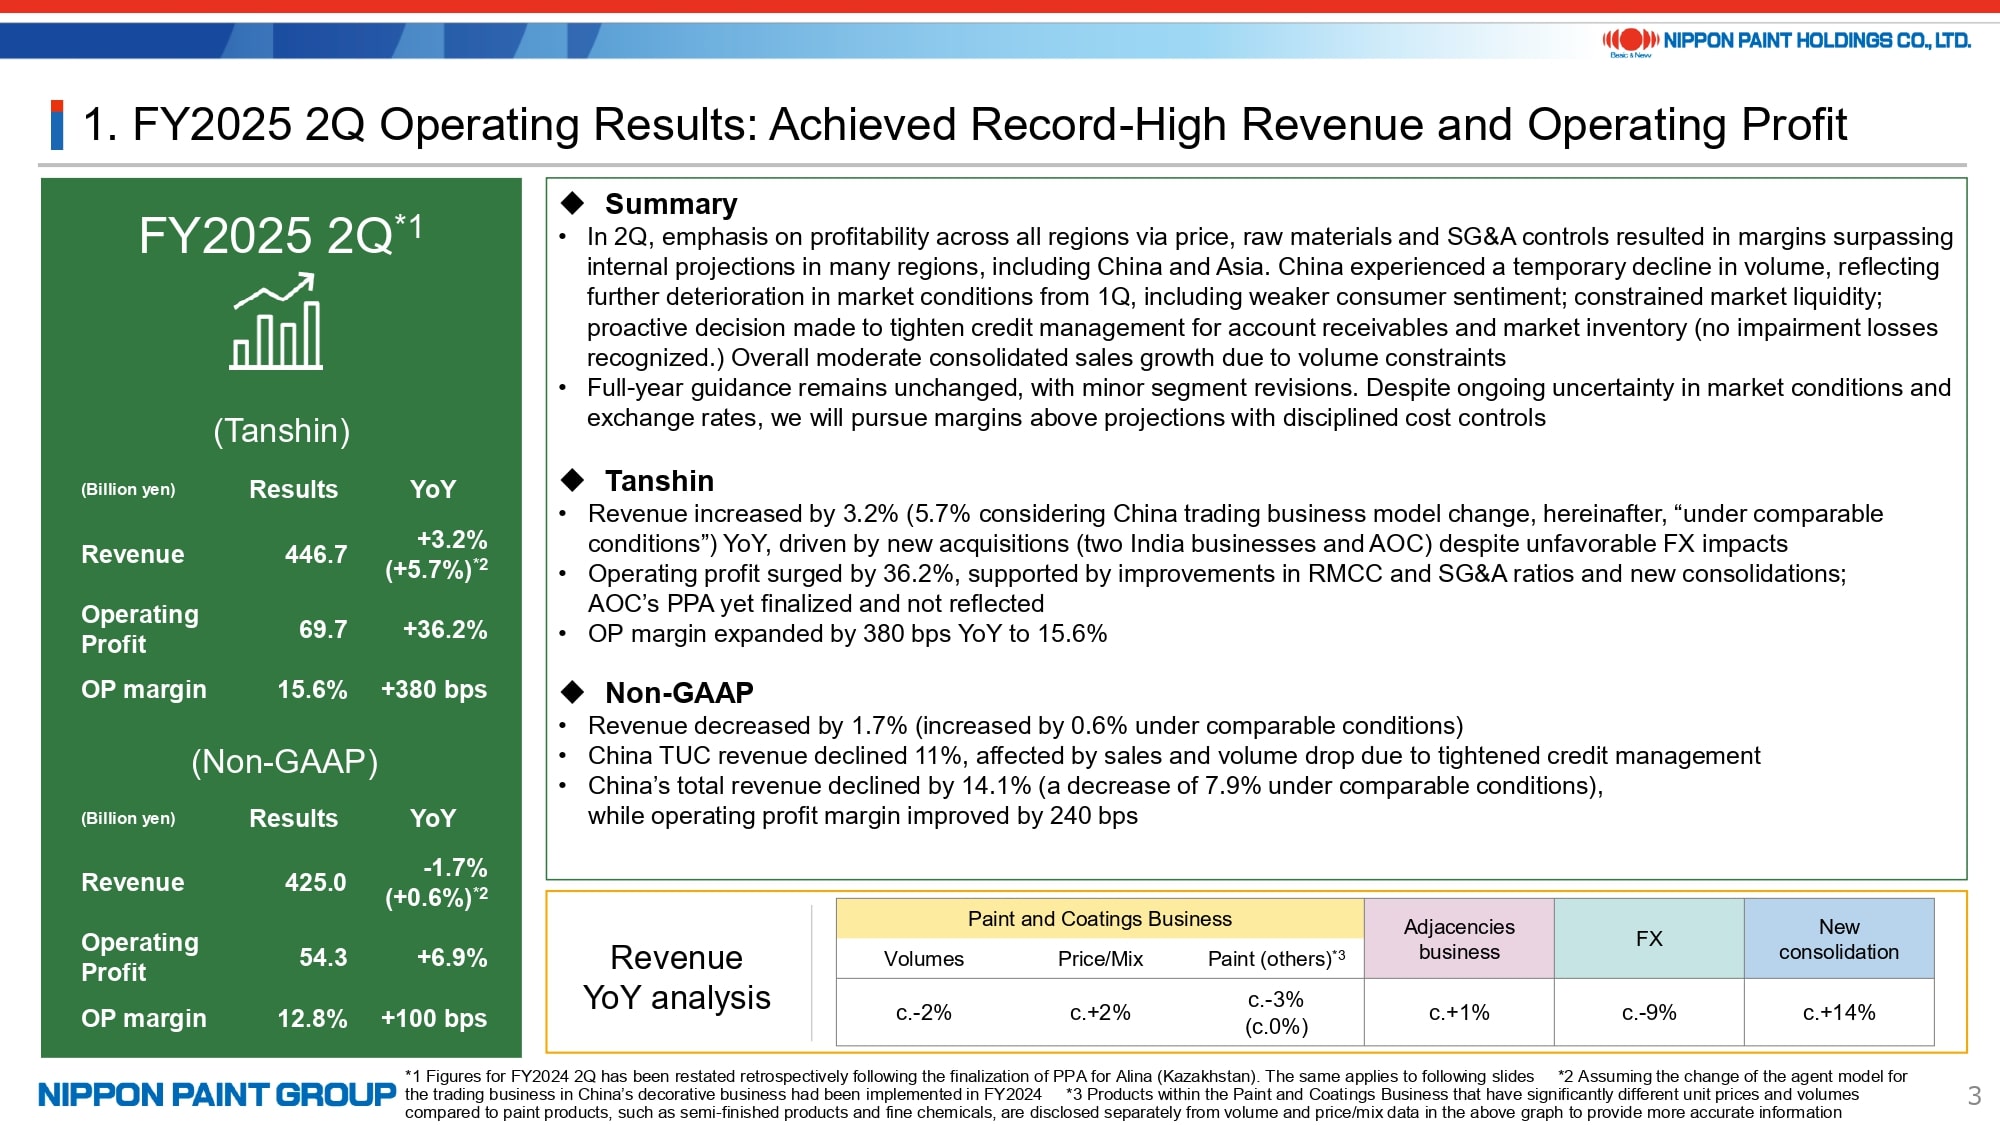
Let me begin with a summary of our financial results for the second quarter of FY2025.
On a Tanshin basis, revenue was ¥446.7 billion, up 5.7% year-on-year under comparable conditions, assuming the China trading business model change had been implemented in FY2024. Operating profit reached ¥69.7 billion, representing 36.2% growth from the previous year. Both revenue and profit once again achieved record highs for the quarter.
The full three-month consolidation of our two India businesses and AOC contributed significantly to this performance. In particular, AOC drove a 380-basis point improvement in operating profit margin. As shown in the revenue year-on-year analysis at the bottom of this presentation, exchange rate movements had a substantial negative impact, reducing revenue by approximately ¥38.8 billion (–9%) and operating profit by about ¥5.2 billion compared to the same period last year. The positive contribution of +14% from the newly consolidated AOC and our two India businesses more than offset the adverse FX impact, adding approximately ¥60.4 billion in revenue and ¥18.1 billion in operating profit.
In addition, we continued to enforce rigorous cost controls across the Group. These results underscore the resilience and effectiveness of our Asset Assembler model.
That said, as noted in the summary at the top of this presentation, market conditions remained challenging. The April–June period was characterized by considerable volatility, largely driven by negative sentiment following the imposition of U.S. tariffs. In this environment, we exercised strict discipline over pricing, costs, and SG&A expenses across all regions, and refrained from pursuing aggressive sales expansion. As a result, while revenue growth was moderate, we delivered margins exceeding our initial projections, securing sufficient profits, which continues to be our foremost priority.
On a Non-GAAP basis, excluding the effects of foreign exchange and new consolidations, revenue grew 0.6% year-on-year under comparable conditions, operating profit increased 6.9%, and margins improved by 100 basis points. Within NIPSEA China, sales in the TUC decorative segment declined 11%, the first year-on-year decrease since this segment classification was introduced. This was mainly due to the extremely challenging market environment, coupled with our initiatives to tighten credit management for accounts receivable, better manage market inventory levels, and deliberately refrain from aggressive sales expansion in order to safeguard profitability. While overall conditions, including the TUB segment, remain difficult, strong performance in the automotive segment drove significant margin improvement and profit growth for NIPSEA China as a whole. We believe these results highlight our prudent vigilance and proactive response to a rapidly changing market environment.
Looking back on the first half, we successfully leveraged our strengths in local production for local consumption of products with stable demand, enabling us to steadily generate profits despite a highly challenging operating environment. Nevertheless, we are not immune to broader market headwinds, whether in the decorative or industrial segments, or in AOC’s formulation business, and we anticipate continued downward pressure on volumes. As we enter the second half, our focus remains on rigorous cost control while pursuing profitable growth opportunities.
Regarding our financial guidance for FY2025, there are no changes from the forecasts announced in April. As shown in the regional summaries on the next page, revenue is expected to come in somewhat softer than our April outlook; however, margins are generally trending higher. We remain firmly committed to prudent management and to delivering on our operating profit targets.
3. Assumptions for FY2025 Guidance
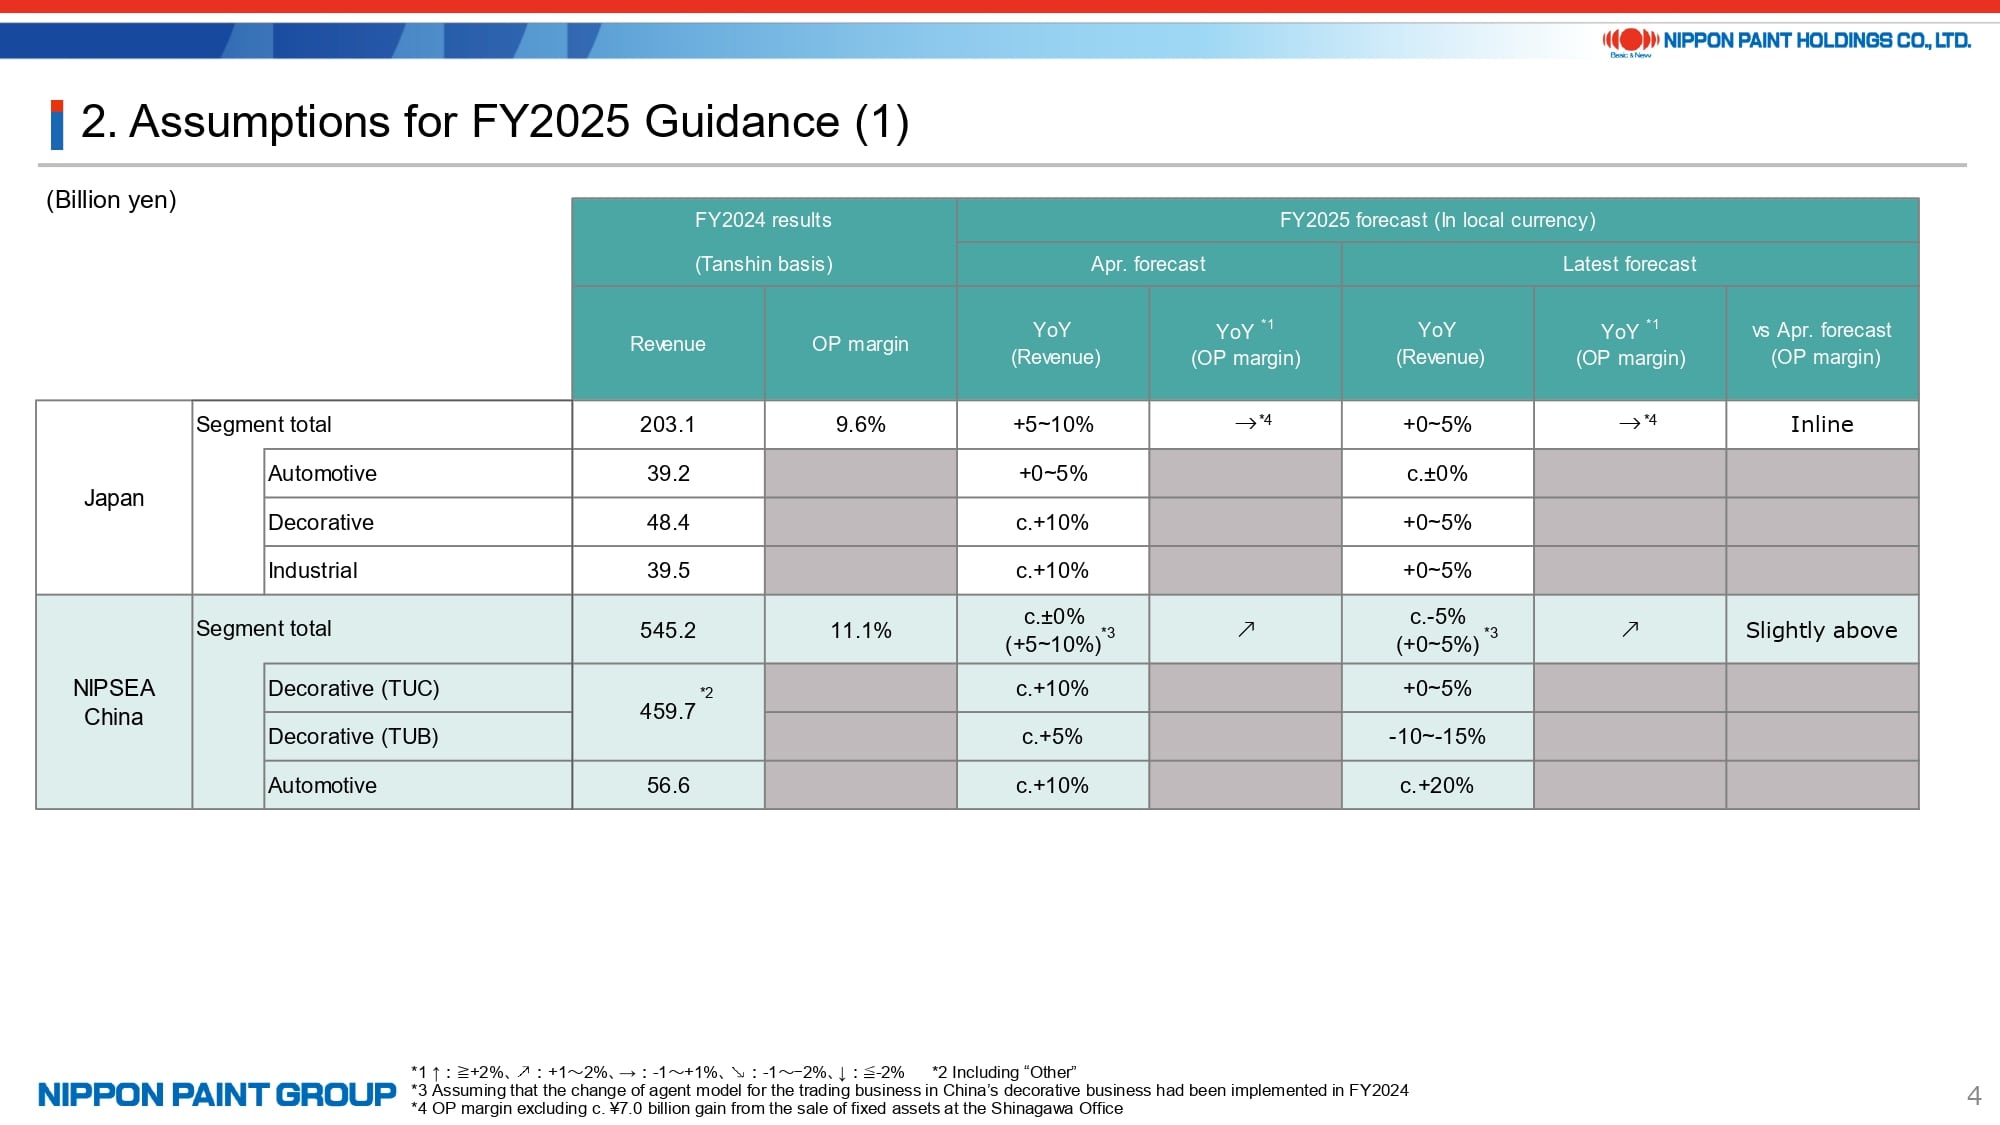
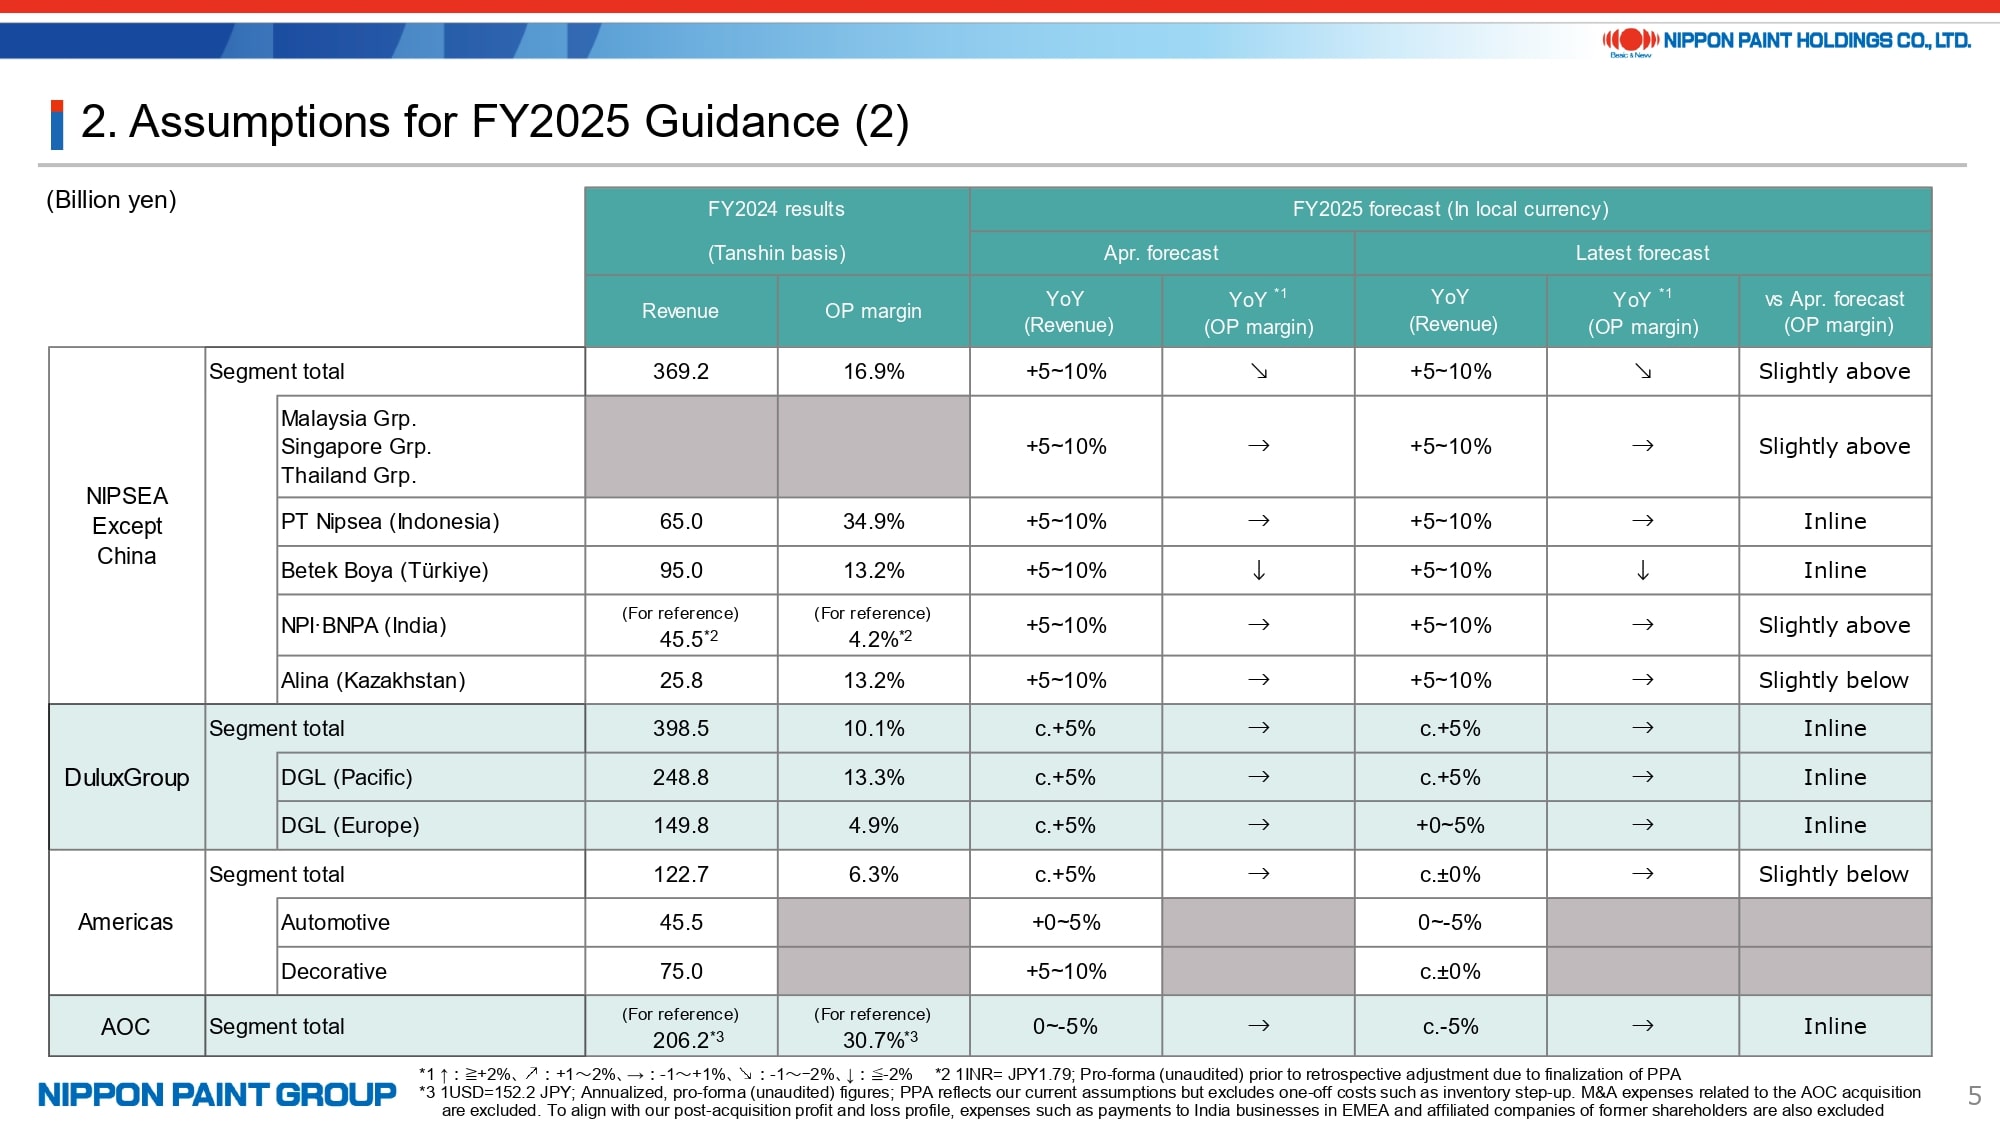
On pages 4 and 5 of the presentation, we have included updated regional forecasts based on our most recent projections.
In summary, we have made slight downward revisions to revenue forecasts for Japan, NIPSEA China, DGL (Europe), the Americas, and AOC. Within NIPSEA China, while the decorative segment continues to face challenges, we have revised our revenue outlook for the automotive segment upward, reflecting market share gains.
As shown in the comparison with our April forecast on the right-hand side of this page, operating profit margins remain largely in line with, or slightly above, our previous projections. This improvement reflects lower raw material cost contribution ratios and continued disciplined cost control across the Group.
4. Raw Material Market Conditions and Operational Impact
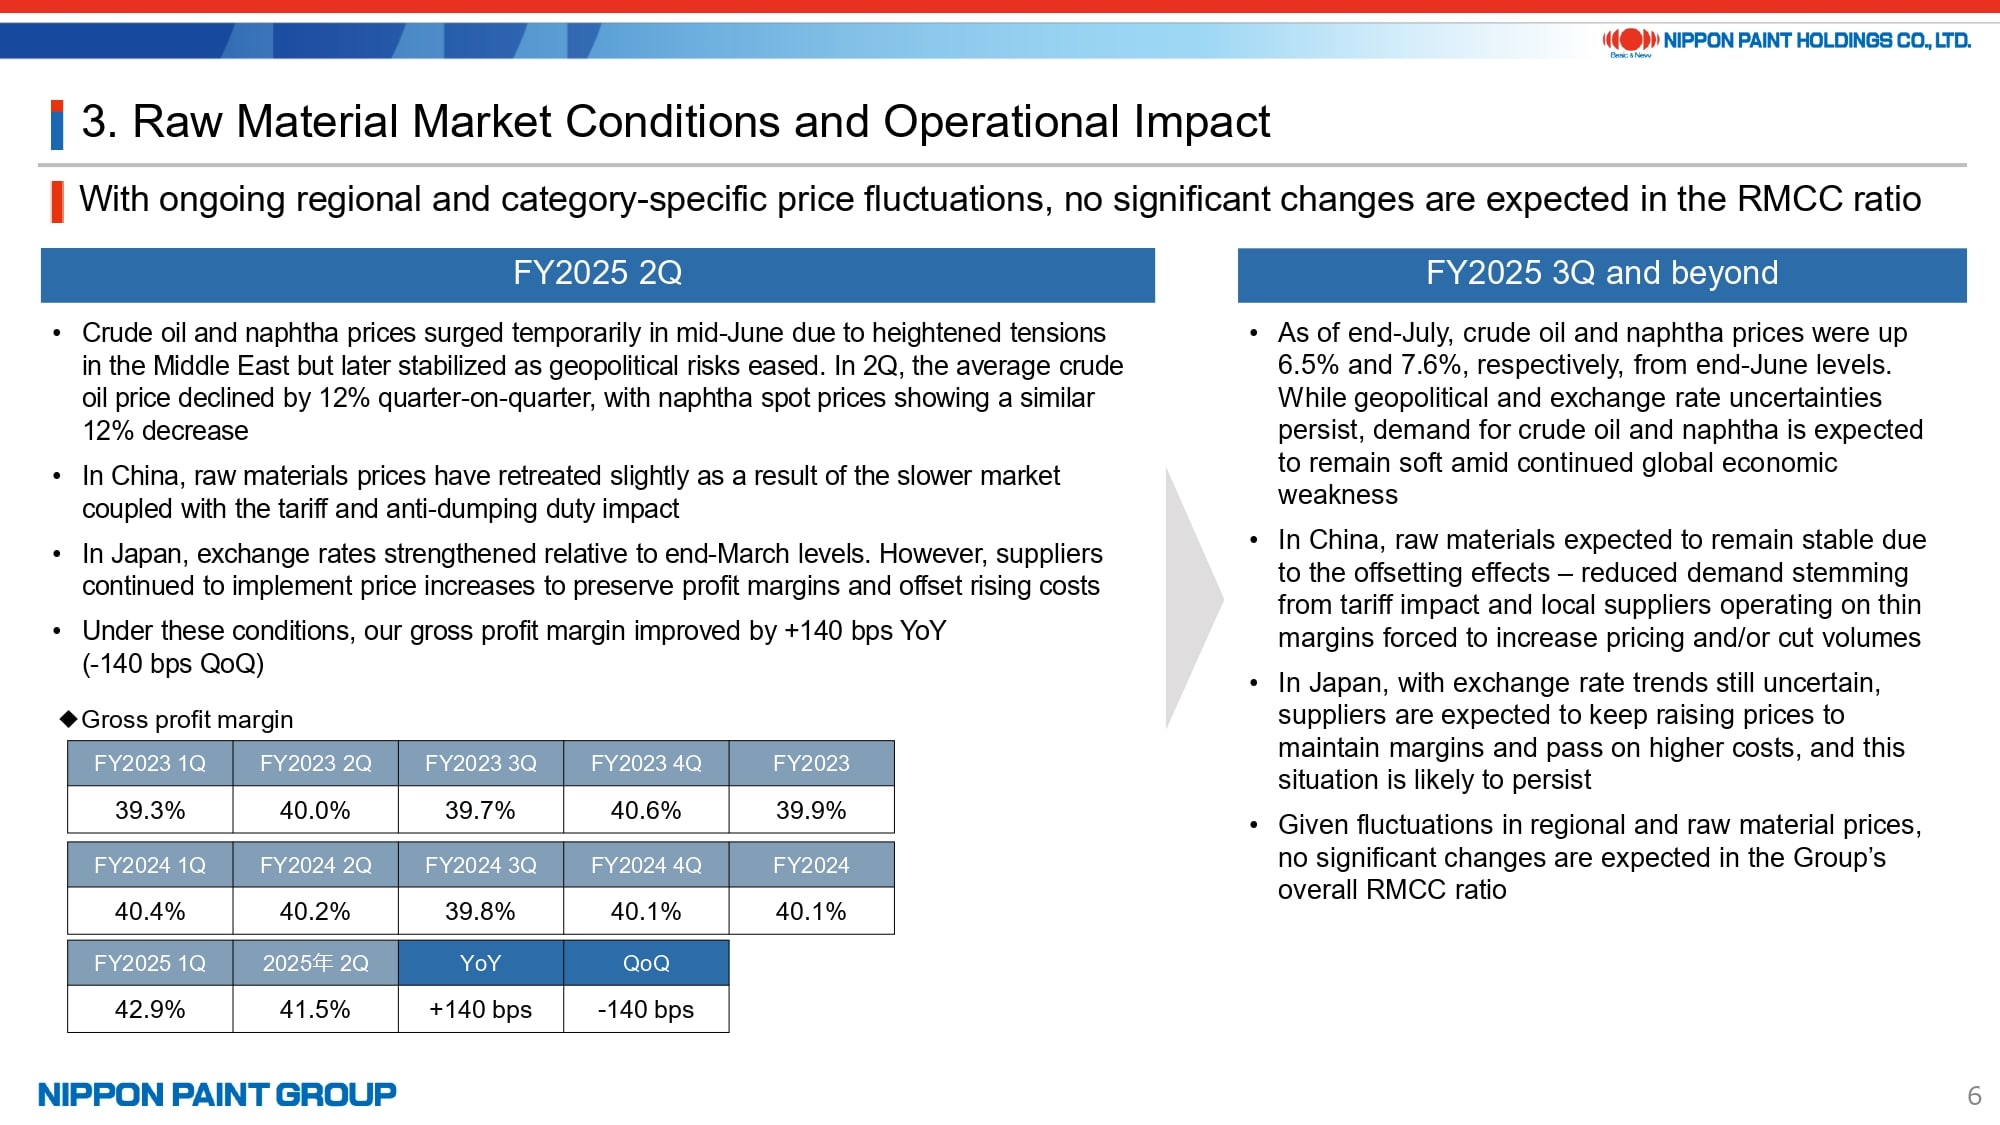
Despite regional differences in raw material price movements, overall volatility remains limited. Gross profit margin for 2Q improved by 140 bps compared to last year.
5. Summary of Operating Results in Major Segments
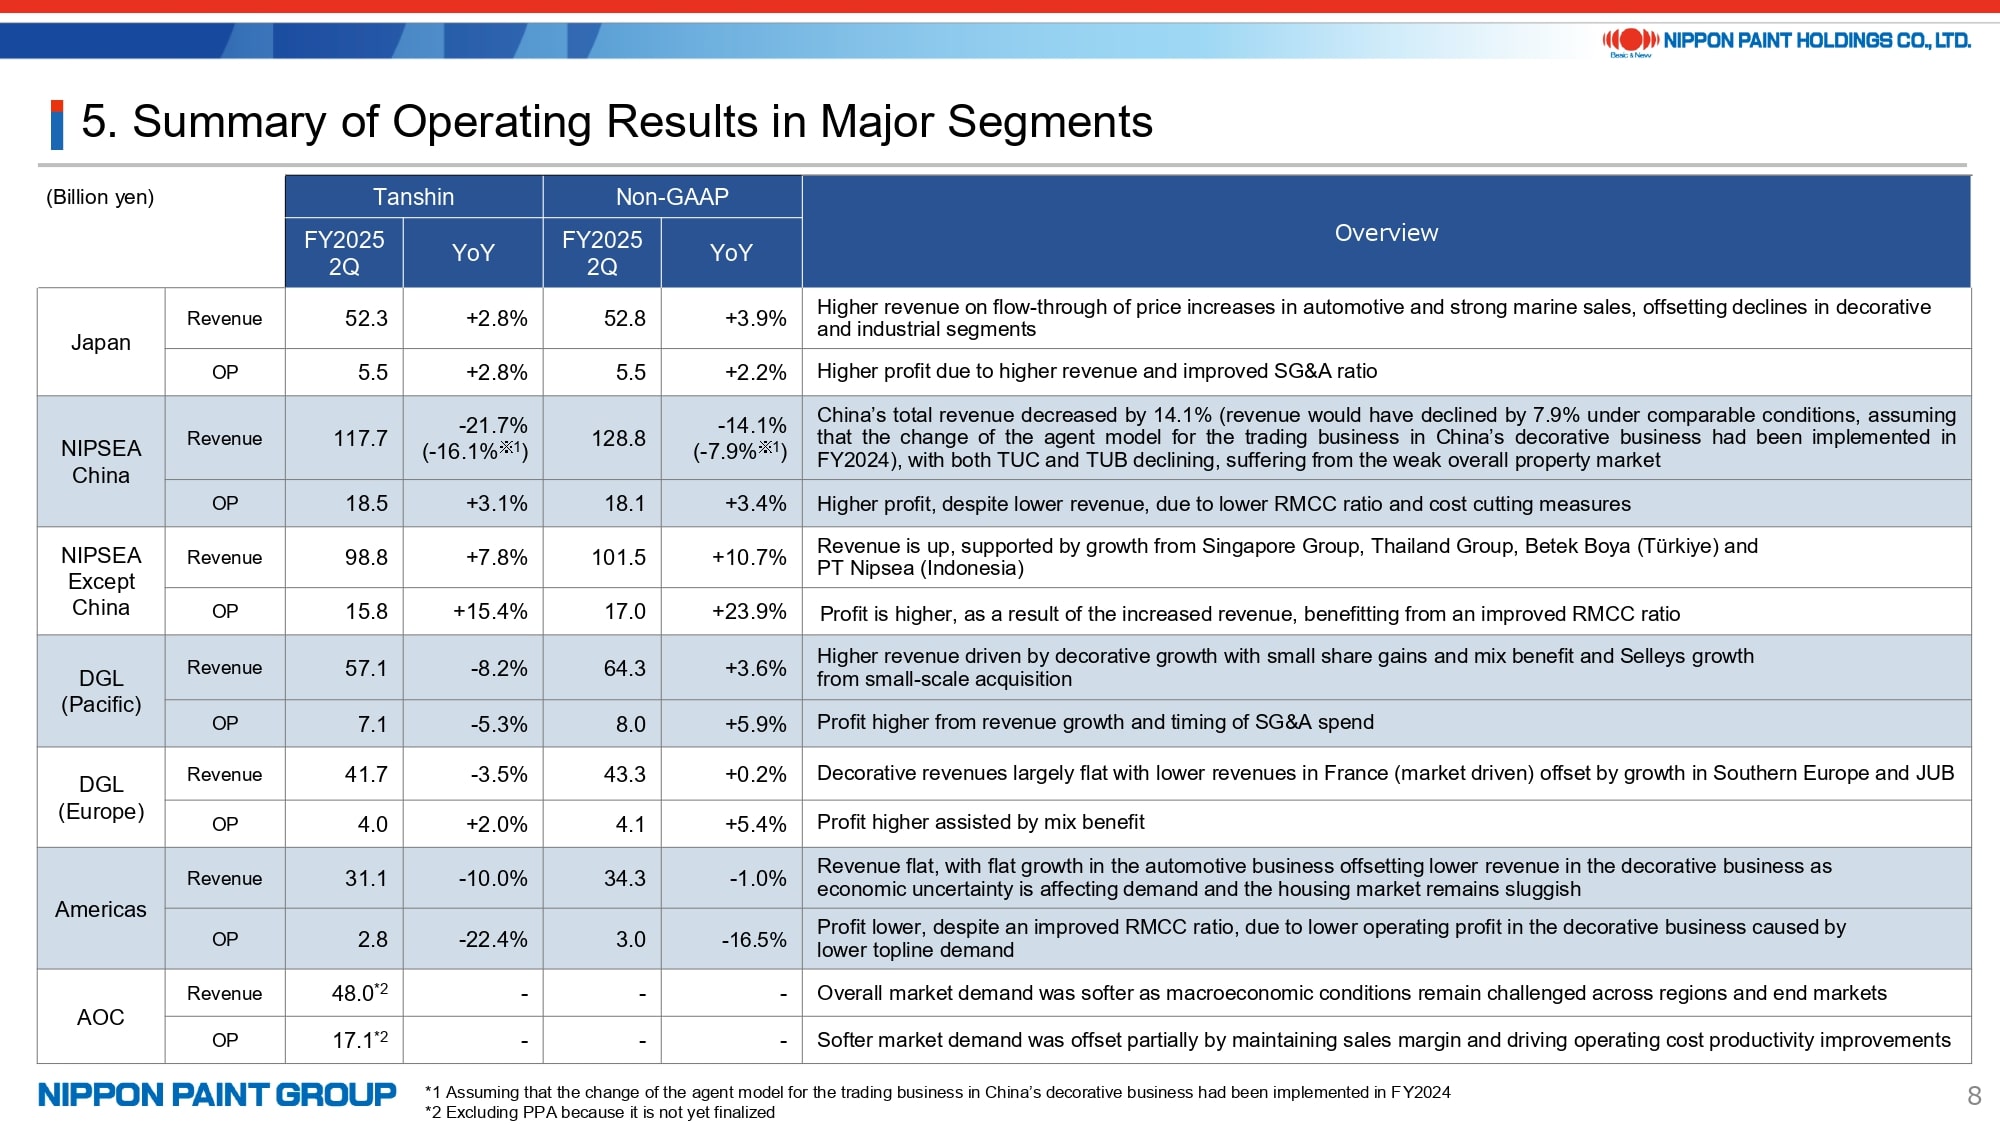
I will skip the heatmap on page 7 and move directly to page 8, which provides an overview of our major segments. While I will leave the detailed discussion for the Q&A session, let me briefly comment on each region.
- Japan: Volumes remained very weak in both the decorative and industrial segments. However, solid performance in the automotive and marine segments supported overall increases in revenue and operating profit. As the difficult conditions in the decorative and industrial segments are expected to persist, we have revised our full-year revenue outlook for this segment downward, as shown on page 4.
- NIPSEA China: I will not go into further detail here, as the situation was already explained earlier.
- NIPSEA Except China: Revenue and profit growth on a Tanshin basis were lower than on a non-GAAP basis, excluding M&A effects, primarily due to adverse exchange rate impacts. Market conditions remained challenging across the region, including Indonesia. That said, we delivered solid profitability in certain markets such as Türkiye. In Türkiye specifically, the effective rollout of sales campaigns and the pass-through of price increases supported a recovery in revenue and operating profit growth on a non-GAAP basis. Even after applying hyperinflationary accounting, we achieved a strong operating profit margin of 17.2%. Nonetheless, Türkiye remains one of the more volatile markets within our Group.
- DuluxGroup: In the DGL (Pacific) segment, market conditions remained largely unchanged year-on-year. However, revenue increased and operating profit margin improved, supported by a stronger product mix. This resulted in approximately 6% operating profit growth on a non-GAAP basis. We are also seeing early signs of recovery, such as interest rate cuts, and believe that DuluxGroup is well positioned to be among the first to benefit as conditions improve. In DGL (Europe), while the French market continued to contract, growth in other regions offset this weakness. Overall revenue was broadly in line with last year, and operating profit improved on a non-GAAP basis.
- Americas: Automobile production declined across the region, but our automotive revenue held largely stable year-on-year. In the decorative segment, although price increases were implemented in the first quarter, demand softened under persistently high interest rates, resulting in a year-on-year decline in operating profit for the region overall.
- AOC: AOC contributed a full three months to our results starting in the second quarter; however, the purchase price allocation (PPA) has not yet been finalized and is therefore not reflected in our reported figures. In terms of market conditions, anticipated U.S. interest rate cuts have not materialized, and demand in Europe has weakened. Nevertheless, AOC maintained very strong margins and continued to deliver a significant profit contribution. Please note that the PPA is expected to be finalized in the fourth quarter, at which point we plan to record ten months of amortization and one-off inventory step-up expenses. The PPA amount estimated in October 2024 remains unchanged in our full-year guidance, at just over ¥9 billion in total, including roughly ¥2 billion in one-off expenses. These figures may be subject to change once the PPA is finalized.
6. Major Topics
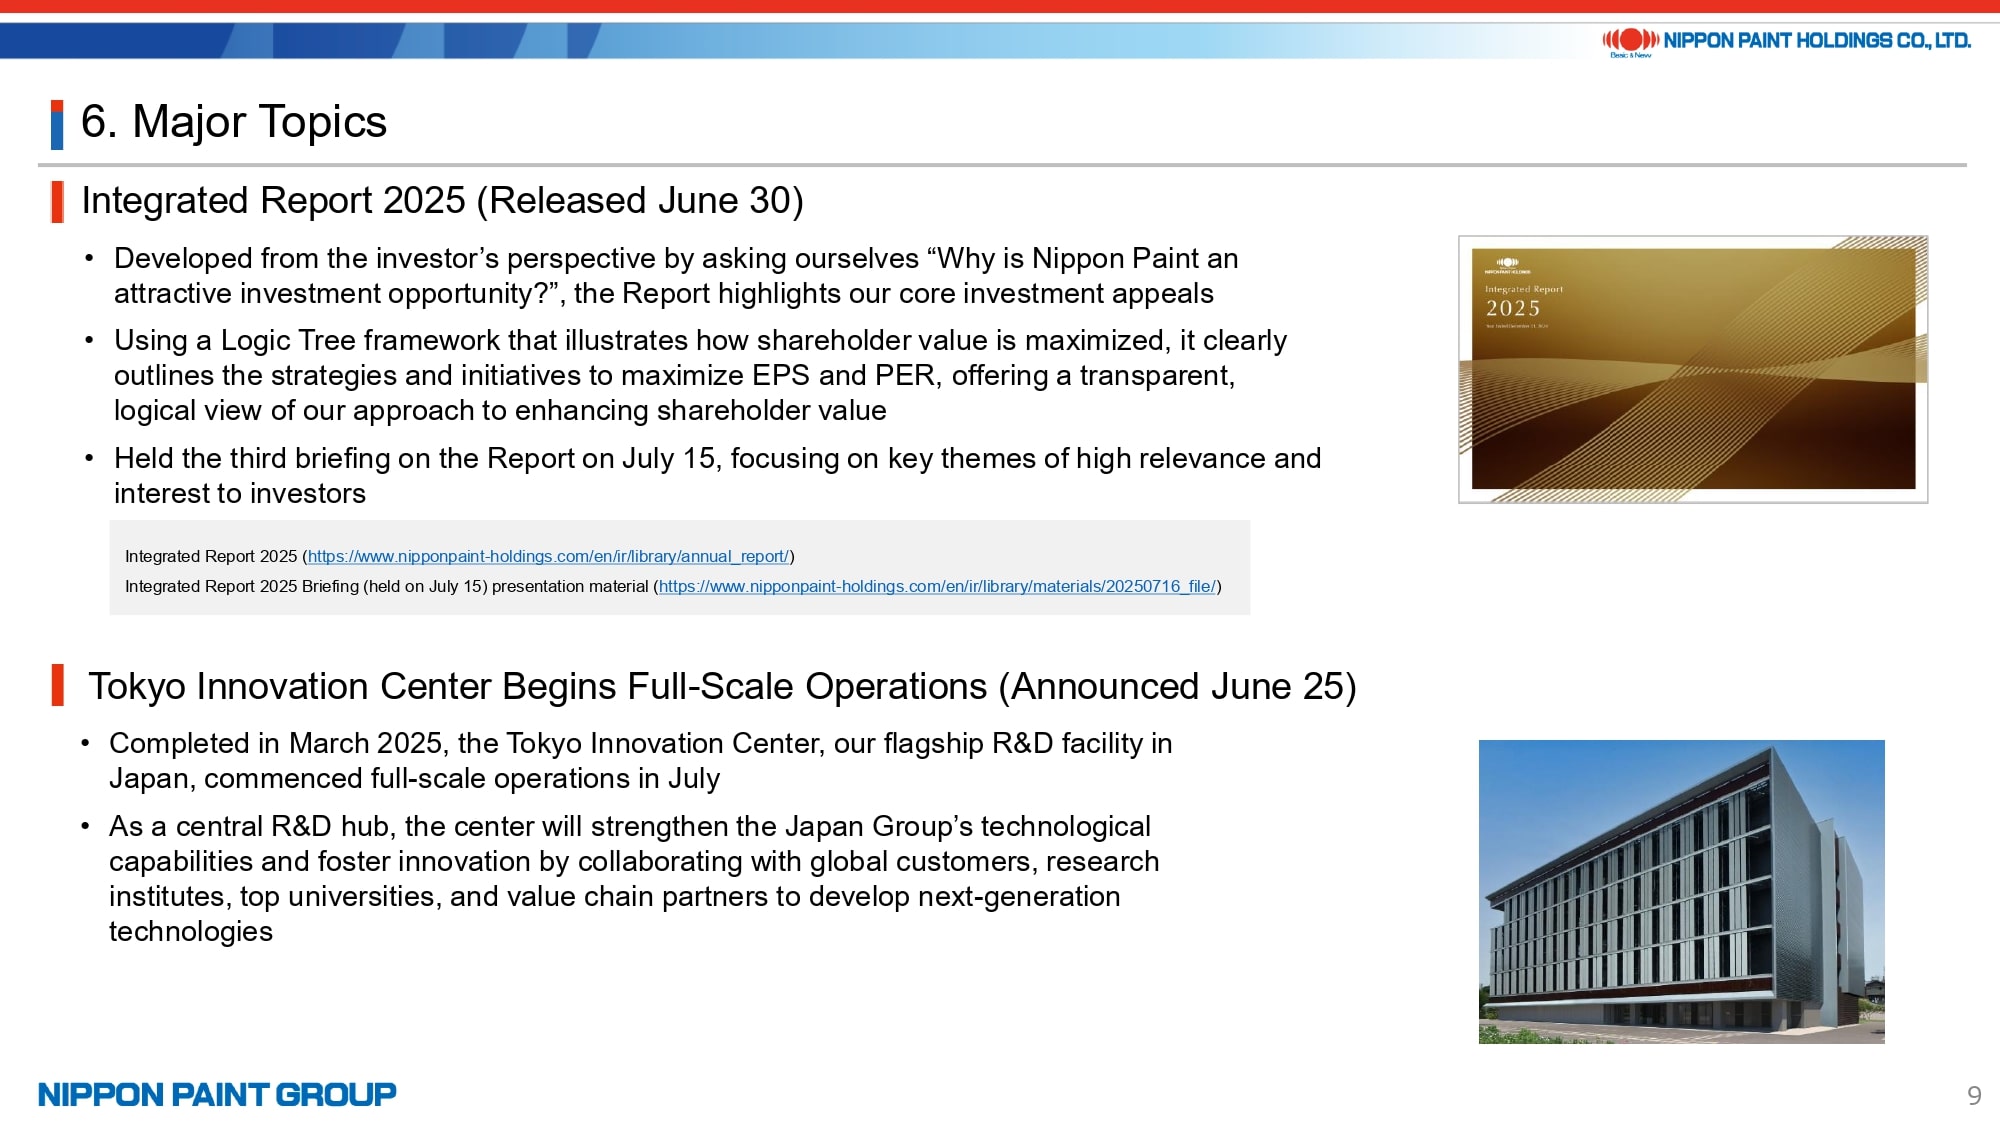
There are two topics I would like to highlight.
First, we released our Integrated Report 2025 at the end of June, a month earlier than last year. The report incorporates the investor perspective more deeply than in the past, and we look forward to further strengthening our dialogue with the investment community. Your feedback is most welcome.
The second topic is the launch of the Tokyo Innovation Center, which we announced at the end of June and celebrated with an inauguration ceremony. The center consolidates functions previously spread across multiple sites after the Japan segment spin-off and is positioned as a hub for technological innovation and new ideas.
Thank you for your attention.