2021
5.2%

Our basic Management Policy, Management Strategy, Medium-Term Management Plan, and competitive strengths
Capital Allocation Centered on M&A to Maximize
EPS
Capital Allocation
Director, Representative Executive Officer & Co-President Yuichiro Wakatsuki
Our financial discipline focuses on prioritizing debt financing while preserving leverage capacity to maintain access to low-cost funding. Recognizing the crucial importance of fostering a clear understanding of our risk profile among financial institutions and rating agencies, we actively engage in dialogue with them and enhance our disclosure materials.
The five points below summarize the principles we emphasize in pursuing the maximization of EPS through capital allocation centered on M&A.
ROIC is one of our key financial metrics, and the capital efficiency of both acquired and existing businesses has been improving year by year.
With M&A as a cornerstone of our growth strategy and ROIC being affected by goodwill recognized in acquisitions, an approach overly focused on ROIC does not align with MSV.
High RNOA, reflecting superior asset efficiency, and a low capital expenditure-to-sales ratio, demonstrating strong cash generation, are clear indicators of high business quality.
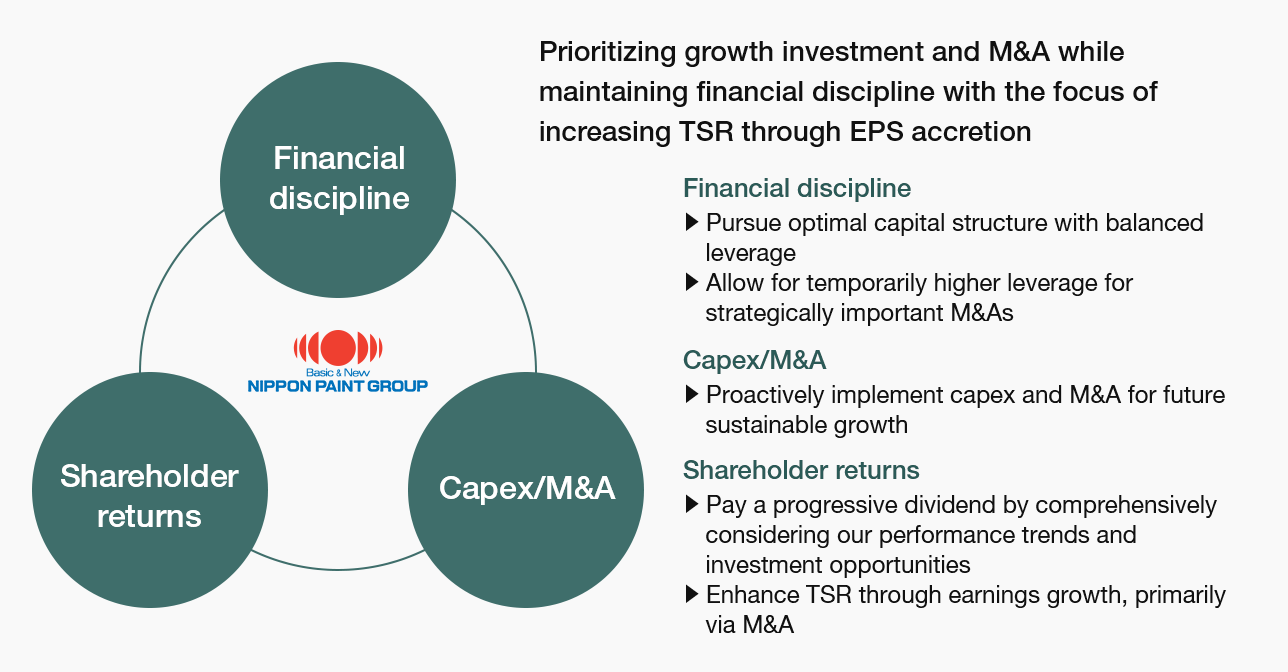
Our capital allocation policy prioritizes growth-oriented investments, primarily M&A, and we have adopted a progressive dividend policy.
Share buybacks are undertaken as a capital allocation decision when our share price is undervalued and earnings are robust, with a clear focus on EPS growth. They are fully compatible with M&A and maintain our Asset Assembler model.
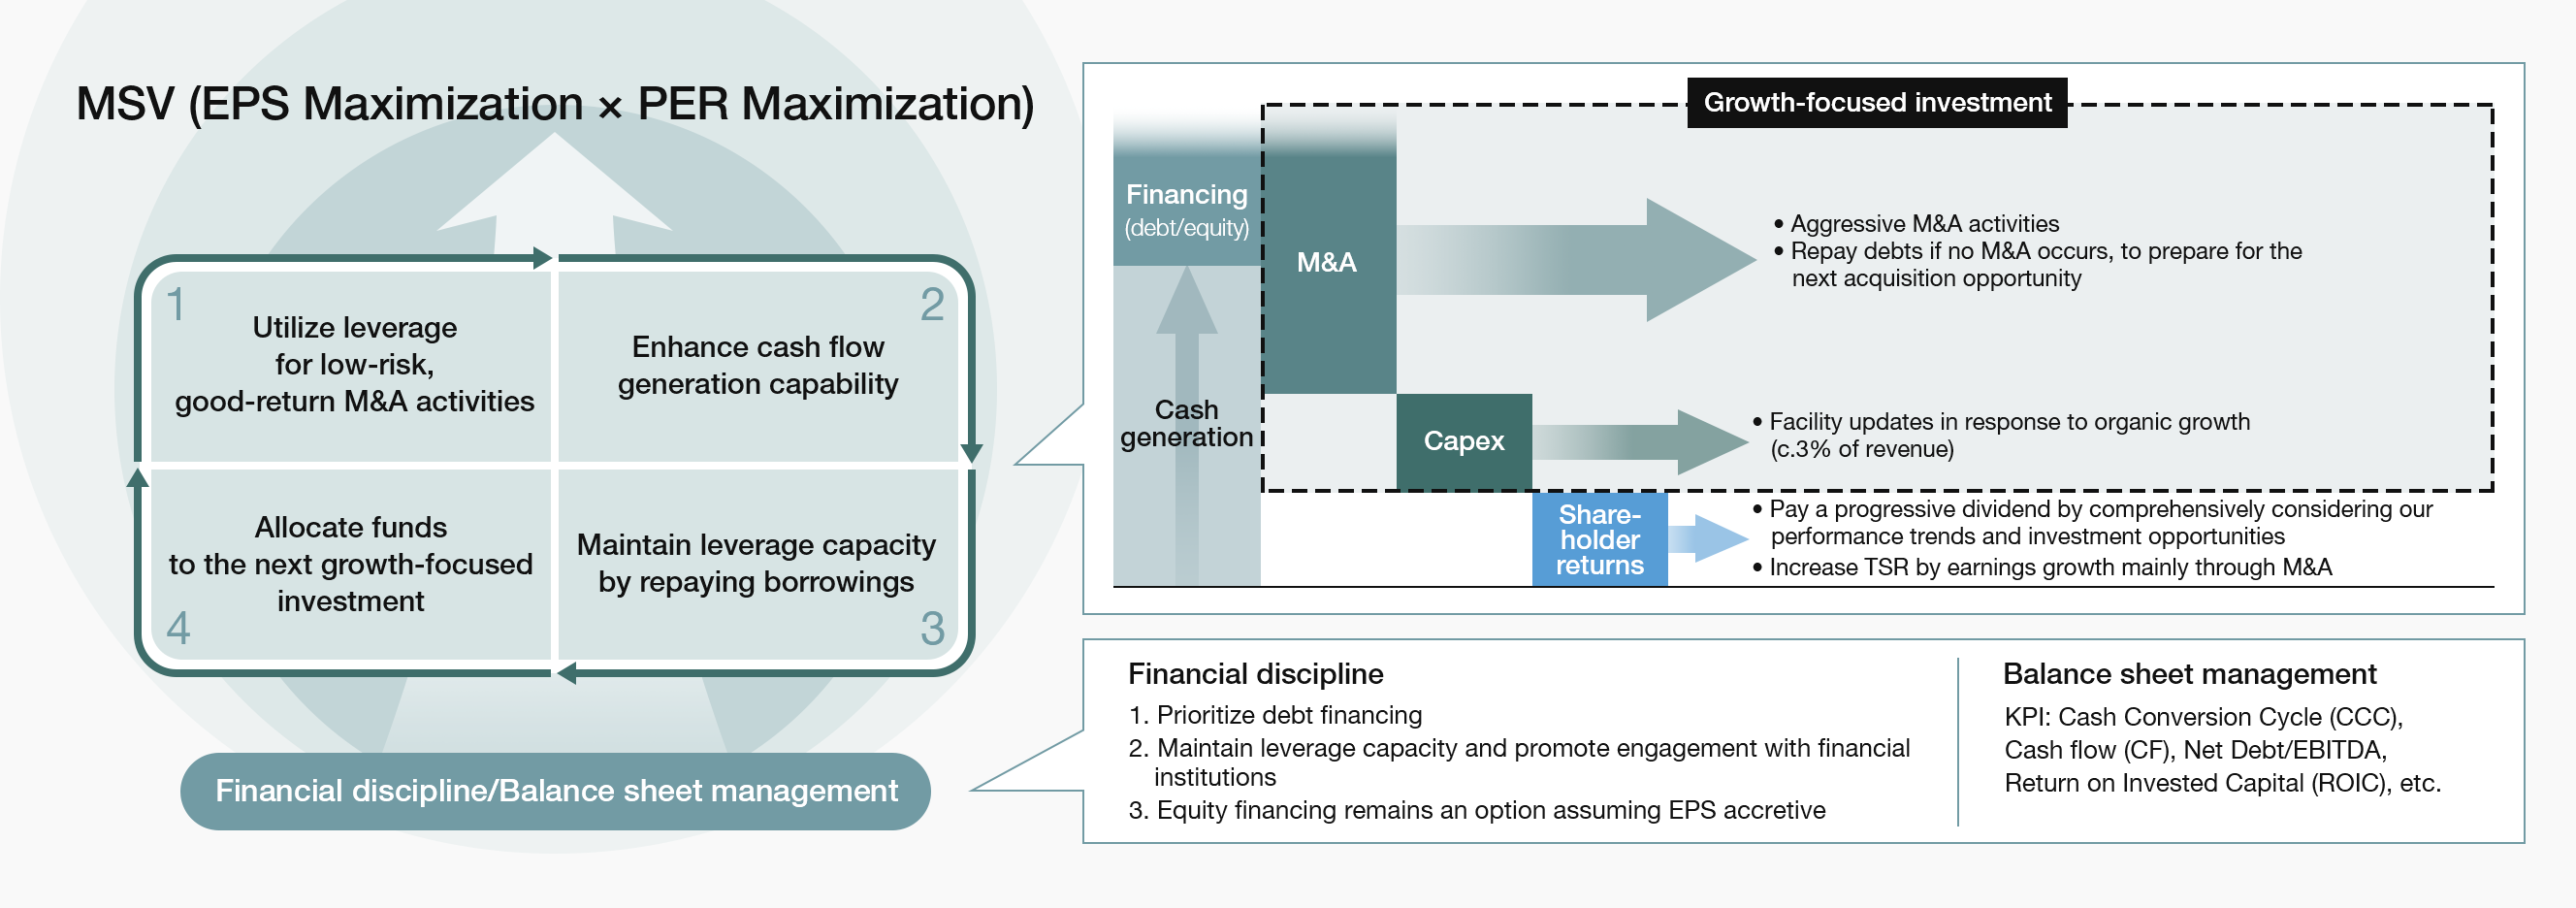
Our capital policy prioritizes growth-oriented investments while maintaining financial discipline, with the primary objective of sustained and long-term maximization of EPS, ultimately leading to the maximization of PER.
We have maintained strong cash generation, and our asset portfolio is fundamentally composed of partner companies capable of autonomous growth and stable cash generation. Moving forward, while retaining ample debt capacity to seize new opportunities, we will strive for an optimal capital structure and work to foster trust and creditworthiness with financial institutions and rating agencies.
We deploy capital expenditures aimed at securing sustainable future growth, noting that the burden of capital investment is relatively small, accounting for only around 3% of revenue, mostly in maintenance and replacement capex. We maintain a disciplined approach to new investment initiatives, including production capacity expansion and investment to advance AI utilization, DX, and research and development across all regions and business segments. Consequently, M&A remains our most capital-intensive investment. In line with our Asset Assembler model, we will continue to focus on accumulating high-quality, low-risk M&A at reasonable valuations.
Regarding dividends, we currently follow a progressive dividend policy, whereby dividends will be
maintained or increased with no reductions as a general principle, taking into comprehensive consideration our
performance trends and investment opportunities.
We announced a share buyback in October 2025 because we judged
our share price to be significantly undervalued. Taking future EPS growth into account, we concluded that
repurchasing shares at the prevailing PER represented an attractive use of capital. In other words, with earnings
remaining robust while the share price was undervalued, we selected share buybacks as a capital allocation option.
Given our continued strong cash generation, we also determined that share buybacks can be pursued alongside future
M&A. There is no change to our core strategy, including the Asset Assembler model. (For trends in financial
indicators, see “Financial Highlights”).
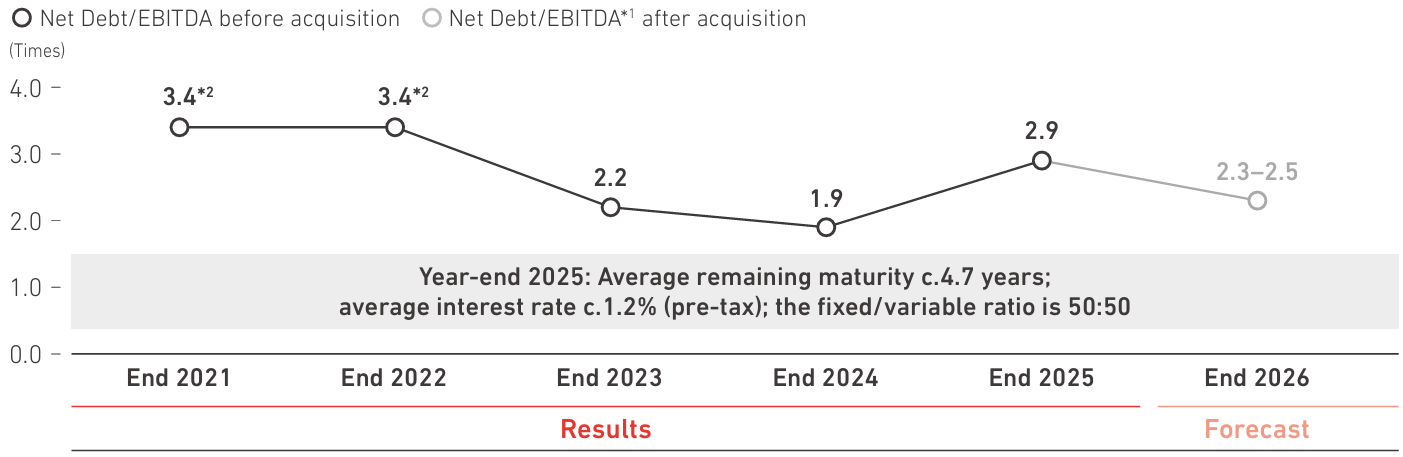
We have maintained strong cash generation, and our asset portfolio is fundamentally composed of partner companies that are capable of autonomous growth and stable cash generation. Strong cash generation driven by revenue growth in 2025 improved our year-end net debt/EBITDA ratio to 2.9 times, better than initially expected, even after the AOC acquisition and share buybacks. Assuming no additional M&A, we expect this ratio to decline further to 2.3–2.5 times by the end of 2026. Our financial soundness remains robust, even compared with the track record of our competitors.
As of December 31, 2025
“Cash and cash equivalents”
“Trade and other receivables”
“Other financial assets (non-current assets)”
“Property, plant and equipment”
“Goodwill” and “Other intangible assets”
“Bonds and borrowings”
(interest-bearing debt)
“Capital”
“Retained earnings”
We have maintained strong cash generation, and our asset portfolio is fundamentally composed of
partner companies capable of autonomous growth and stable cash generation. Strong cash generation driven by revenue
growth in 2025 improved our year-end net debt/EBITDA ratio to 2.9 times, better than initially expected, even after
the AOC acquisition and share buybacks. Assuming no additional M&A, we expect this ratio to decline further to
2.3–2.5 times by the end of 2026. Our financial soundness remains robust, even compared with the track record of our
competitors.
Moving forward, while retaining ample debt capacity to seize new opportunities, we will strive for
an optimal capital structure and work to foster trust and creditworthiness with financial institutions and rating
agencies.
(For details of rating trends, see “Bonds and Ratings”).
*1 Assuming no additional acquisitions
*2 Excluding one-off items
In 2025, our consolidated ROIC was 7.6%, representing an improvement over the previous year. This improvement was
primarily attributed to (1) an improvement in operating profit margin and (2) higher after-tax operating profit
driven by business growth. Our WACC is estimated to be around 5–6%.
Over the past five years, while EPS has steadily increased, ROIC has remained in the range of approximately 5–7%.
This stability is largely due to the recognition of goodwill associated with our active M&A activities, which we
consider inevitable for a company that places M&A as a pillar of its growth strategy. Invested capital has
increased annually, while after-tax operating profit has risen steadily over the five years through 2025. Moreover,
our RNOA is high at approximately 31%, while our capital expenditure-to-sales ratio is low at approximately 3%,
underscoring the high asset efficiency and strong cash-generating capacity of our businesses and, in turn, the
quality of our business portfolio.
※ROIC
ROIC = After-tax operating profit / Average of (working capital + tangible fixed assets) over two periods
An effective tax rate of 28% is applied for each fiscal year, based on the average consolidated effective tax rate
over the past three years.
Invested capital = Net debt + Equity (including ownership of non-controlling shareholders)
Net debt = Bonds and borrowings + Total other financial liabilities (current and non-current) − Cash and cash
equivalents − Other financial assets (current)
※RNOA
RNOA = Operating profit / Average of (working capital + tangible fixed assets) over two periods
Working capital = Trade and other receivables + Inventories − Trade and other payables
We have noticed increased interest from investors concerning our approach to ROIC. To address this, I would like to clarify our basis by answering the following questions.
We are sometimes compared with peers based solely on a company-wide ROIC benchmark. However, companies that actively pursue M&A and those that do not typically have fundamentally different asset compositions and growth profiles. Our strength as an Asset Assembler lies in our ability to consistently make safe acquisitions. As we pursue the long-term, sustainable maximization of EPS through acquisitions, we believe that an excessive focus on ROIC alone neither makes the most effective use of our platform nor aligns with our overall strategy.
I would like to emphasize that the companies we acquire (1) operate their businesses with high capital efficiency relative to invested capital, such as working capital and capital expenditure, and possess strong cash-generating capacity, and (2) generally present low business risks and a high degree of safety due to their stable business models, strong brands, and high-quality management teams.
We use ROIC as a key indicator of efficiency, while also tracking RNOA as a measure of asset efficiency across our businesses. Together, these metrics show that our Group is, in substance, a highly asset-light portfolio of companies with strong profitability.
To clarify, please refer to Figure B, “ROIC of major acquired assets.” Since we are allocating capital entrusted to us by investors for acquisitions, our standard procedure is to examine the respective ROIC of each acquisition. Our goal is to achieve an ROIC that surpasses the assumed WACC within a few years post-acquisition. Indeed, the five major companies we acquired since 2019 have already seen their ROIC exceed WACC, with all demonstrating year-on-year improvements in ROIC.
We are by no means disregarding ROIC. On the contrary, as our valuation has moderated, our focus on ROIC has become even more disciplined, and we have correspondingly tightened our acquisition standards. At the same time, we do not intend to become overly ROIC-centric in a way that constrains our growth ambition. We believe the appropriate course is to maintain a well-balanced approach.
| 2020 | 2021 | 2022 | 2023 | 2024 | 2025 | |
|---|---|---|---|---|---|---|
| DGL (Pacific) | 3.7%(3.4%) | 4.4%(3.6%) | 5.6%(4.5%) | 5.8%(4.6%) | 7.0%(5.1%) | 7.2%(5.5%) |
| Betek Boya | 7.4%(9.1%) | 9.9%(14.9%) | 7.9%(20.7%) | 11.8%(45.7%) | 16.4%(68.1%) | 18.4%(94.3%) |
| PT Nipsea | - | 3.7%(3.6%) | 5.3%(4.4%) | 6.6%(5.2%) | 7.1%(5.4%) | 7.2%(5.8%) |
| Cromology | - | - | 2.2%(2.1%) | 2.6%(2.2%) | 2.5%(2.0%) | 2.1%(1.6%) |
| JUB | - | - | - | 5.7%(5.2%) | 6.7%(5.6%) | 7.8%(6.3%) |
| AOC | - | - | - | - | - | 7.2%(7.2%) |
| 2020 | 2021 | 2022 | 2023 | 2024 | 2025 | |
|---|---|---|---|---|---|---|
| DGL (Pacific) | 52.4%(32.5%) | 40.1%(23.1%) | 32.9%(28.6%) | 34.2%(29.3%) | 41.6%(32.7%) | 42.3%(34.7%) |
| Betek Boya | 21.9%(20.8%) | 27.3%(33.8%) | 19.0%(47.5%) | 29.3%(104.1%) | 38.3%(155.1%) | 45.8%(214.6%) |
| PT Nipsea | - | 34.7%(34.0%) | 50.2%(41.7%) | 62.2%(48.9%) | 68.4%(51.2%) | 68.1%(55.1%) |
| Cromology | - | - | 50.3%(44.0%) | 35.3%(28.0%) | 31.0%(25.7%) | 23.9%(22.3%) |
| JUB | - | - | - | 12.8%(11.2%) | 15.1%(12.9%) | 17.4%(14.4%) |
| AOC | - | - | - | - | - | 74.3%(74.9%) |
* In Japanese yen; percentages in parentheses are based on local currency
* Assumptions for preparation
The ROIC for DGL (Pacific), Betek Boya, and JUB excludes Year 1, as these companies were acquired during the fiscal
year, and starts from Year 2. PT Nipsea and Cromology, acquired at the beginning of the fiscal year, are included
from Year 1. None of these companies incurred acquisition-related costs in Year 1.
DGL (Pacific): For 2019–2023, the DuluxGroup figures reflect the consolidated total excluding Cromology and JUB.
From 2024 onward, the figures reflect DGL (Pacific) only. For 2022, the figures exclude acquisition-related costs
for Cromology and JUB, including small-scale acquisitions.
Betek Boya: Goodwill deducted from the denominator does not reflect adjustments under hyperinflationary accounting.
After-tax operating profit, the numerator, is shown after applying hyperinflationary accounting.
For AOC, a 12-month pro forma value is used. Inventory step-up is excluded.
For corporate tax rates, Betek Boya
uses the statutory effective tax rate of 25% due to abnormal corporate tax rates under hyperinflationary accounting.
For other companies (PT Nipsea, DGL (Pacific), Cromology, and JUB), the average effective tax rate over the past
three years is applied uniformly across all years.
During our dialogues with investors, some have expressed a desire for double-digit expected growth rates. We note that our business domain generates substantial cash flow that can be deployed toward share buybacks rather than M&A, which would consistently improve ROIC. Indeed, high-ROIC paint manufacturers can demonstrate a scenario of achieving double-digit growth through a combination of single-digit organic EPS growth and share buybacks.
On the other hand, as outlined in our Medium-Term Strategy, we project high-single-digit medium-term organic EPS growth without share buybacks. The substantial cash flow generated is primarily allocated toward M&A that contributes to the maximization of long-term EPS. We aim for exceptional growth through high-single-digit organic EPS growth plus additional upside from M&A contributing to EPS from Year 1 post-acquisition.
Based on this strategy, our approach to returns is twofold: (1) to expand the basis of EPS growth through M&A rather than focusing on short-term shareholder returns, and (2) to reserve cash flows as dry powder, or standby funds, for future M&A, even if leverage declines in the short term.
Within our Asset Assembler model, we pursue opportunities within the chemicals domain, targeting businesses operating in resilient growth markets with clear competitive advantages and strong potential to accelerate under our Group platform. Given the abundance of safe targets that contribute to EPS, we believe our policy and strategy are well grounded. We naturally consider ROIC one of our key indicators and remain dedicated to achieving organic profit growth and shortening the cash conversion cycle.
The six cards below summarize the key financial indicators presented in the Performance Highlights section on page 51 of Integrated Report 2026.
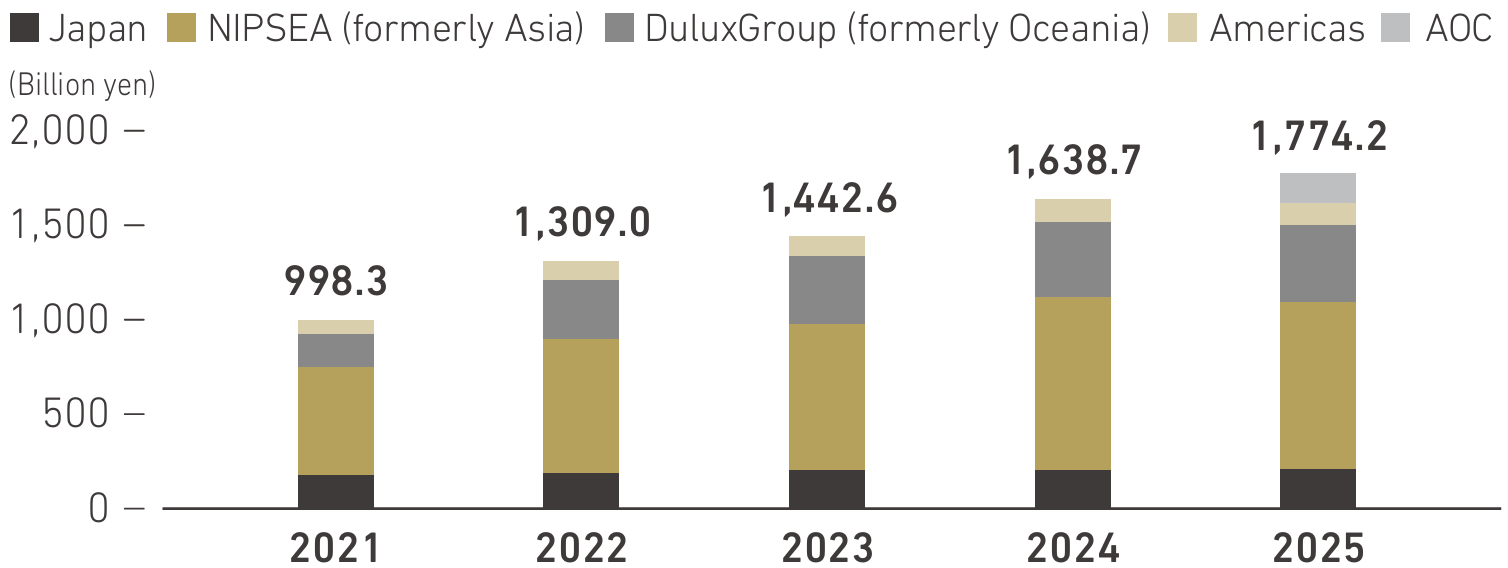
Record-high performance driven by organic growth and M&A Revenue growth accelerated through active M&A and organic growth. In 2025, revenue rose for the ninth consecutive year to a record high, driven primarily by the consolidation of AOC, higher sales volumes, and growth in adjacencies.
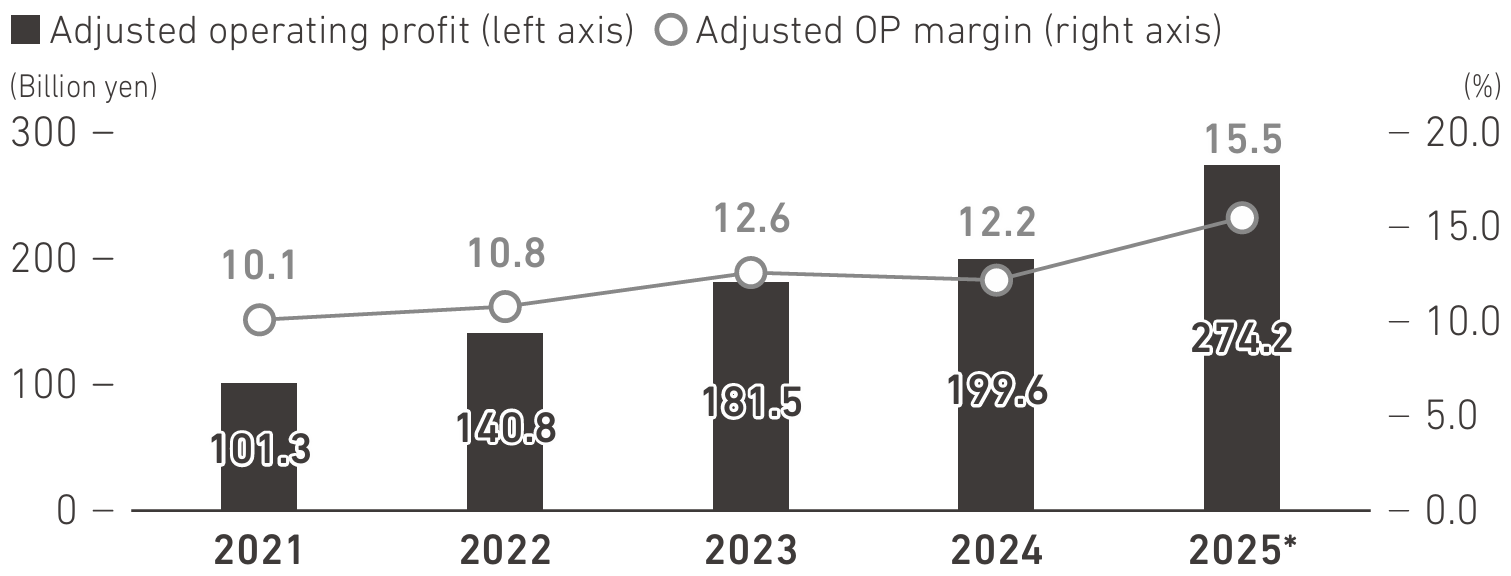
Record high achieved through revenue growth and profitability improvement Operating profit has grown for six consecutive years, driven by sustained revenue growth. In 2025, it reached a record high, supported by higher revenue as well as improvements in the raw material cost contribution ratio and SG&A ratio. Adjusted operating profit margin also rose to 15.5%.
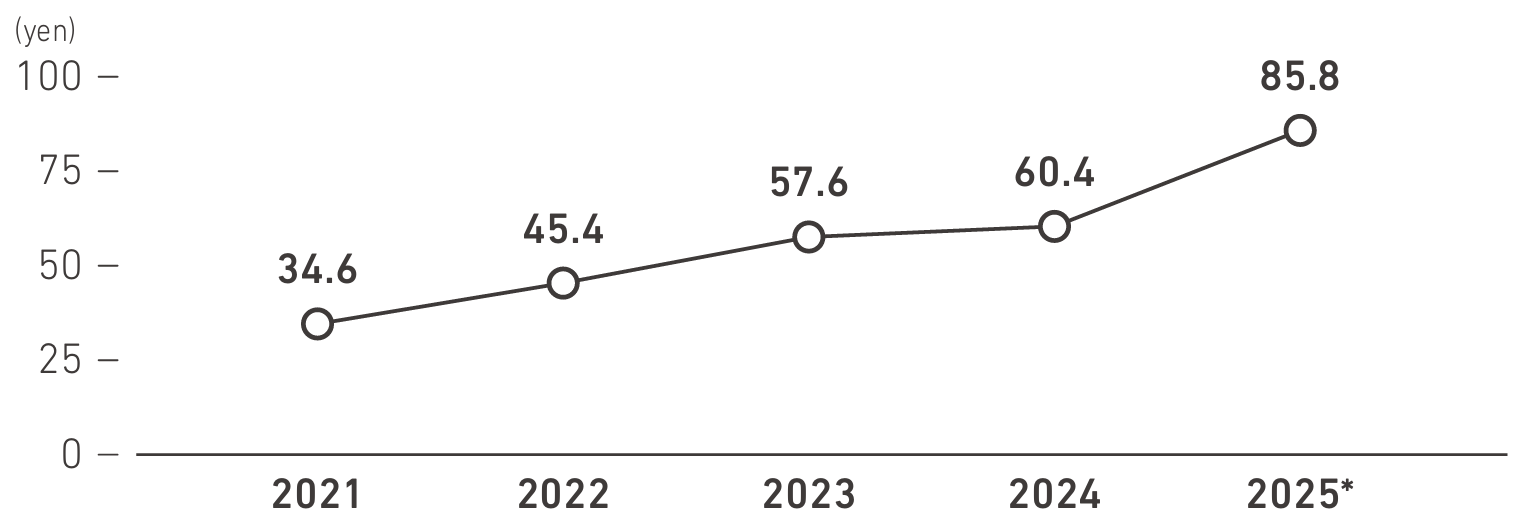
EPS compounding supported by stable profit growth EPS has generally moved in line with operating profit and other earnings metrics. Driven by higher operating profit resulting from revenue growth, EPS has increased for six consecutive years, demonstrating steady and consistent growth.
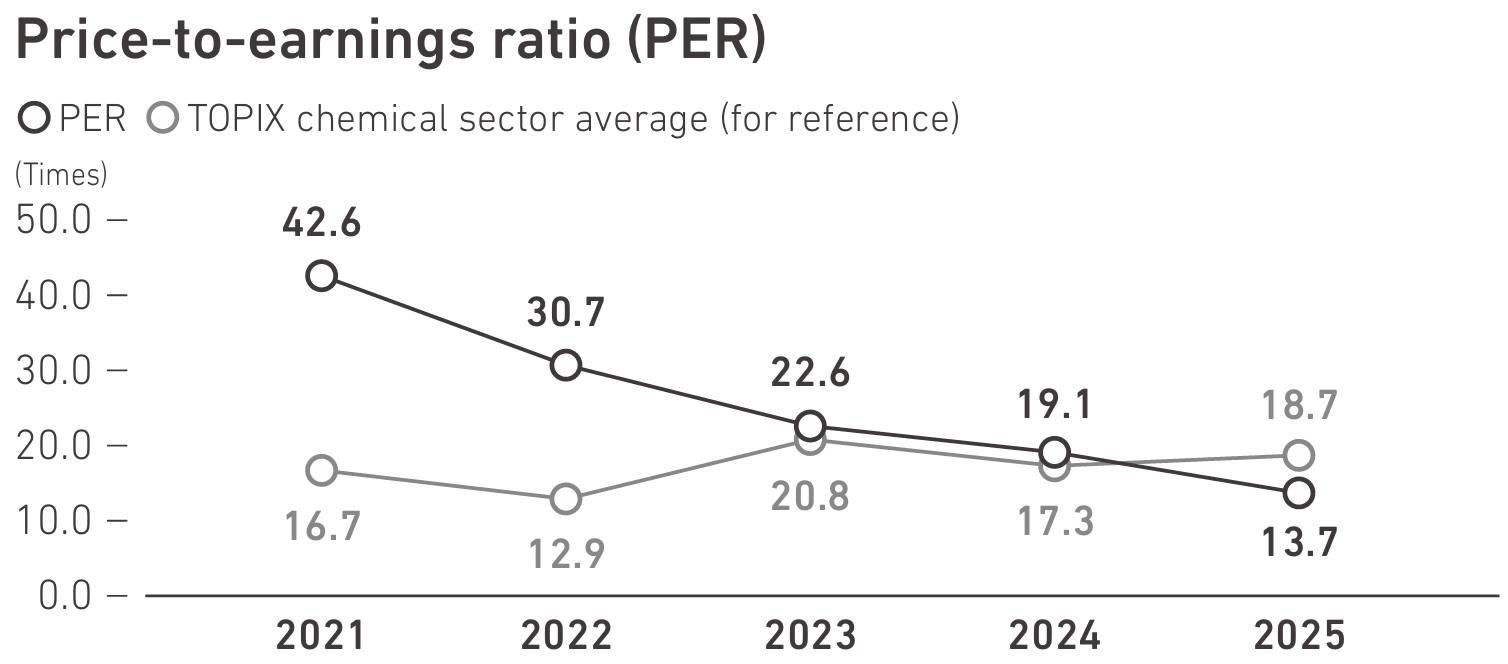
PER trending down, but medium- to long-term valuation upside remains Since 2021, our PER has trended downward, reflecting market concerns over China-related risks and a preference for AI- and semiconductor-related stocks. We believe our current share price remains undervalued and view the current valuation as an attractive opportunity for share repurchases, which we began in October 2025.
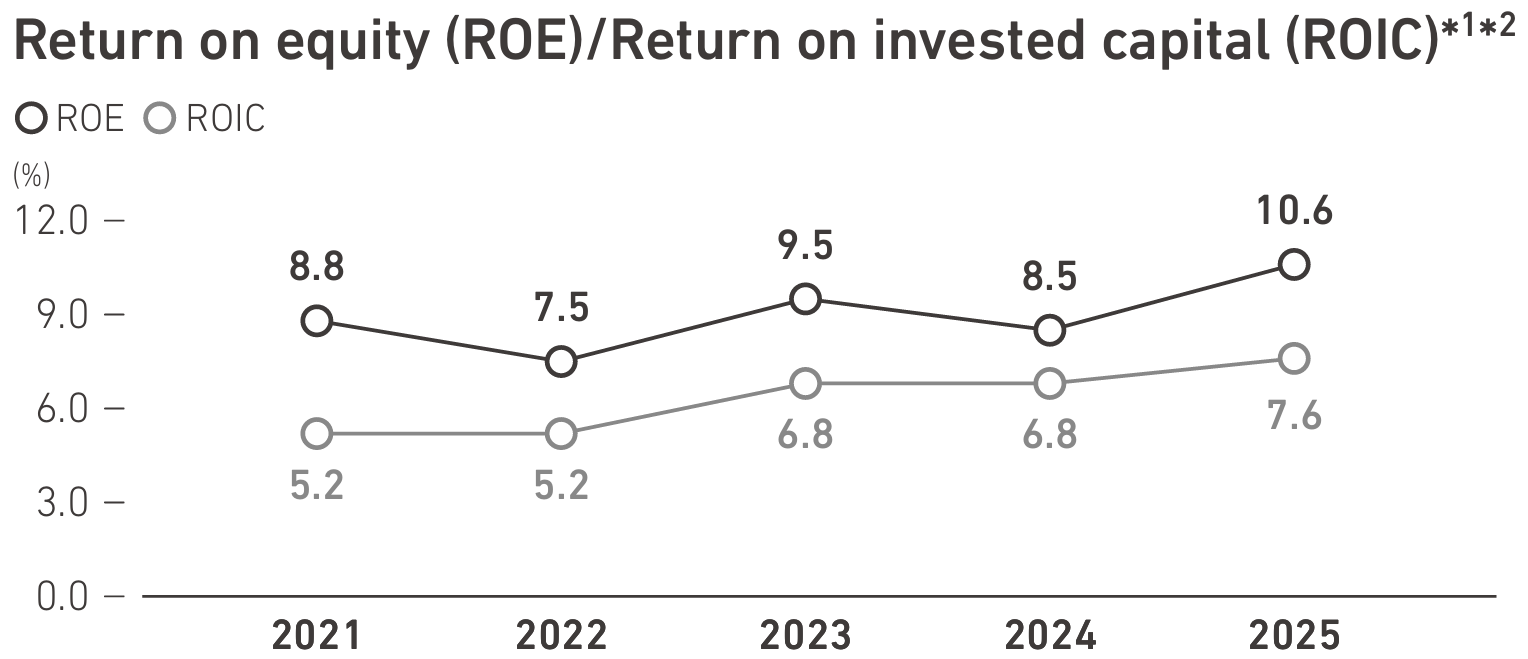
Expansion of economic value through improved capital efficiency ROE had historically been in the 8–9% range, but exceeded 10% in 2025, supported by higher net profit following the AOC acquisition and other strategic initiatives. ROIC also improved in 2025, driven by a higher operating profit margin and growth in after-tax operating profit driven by business growth.
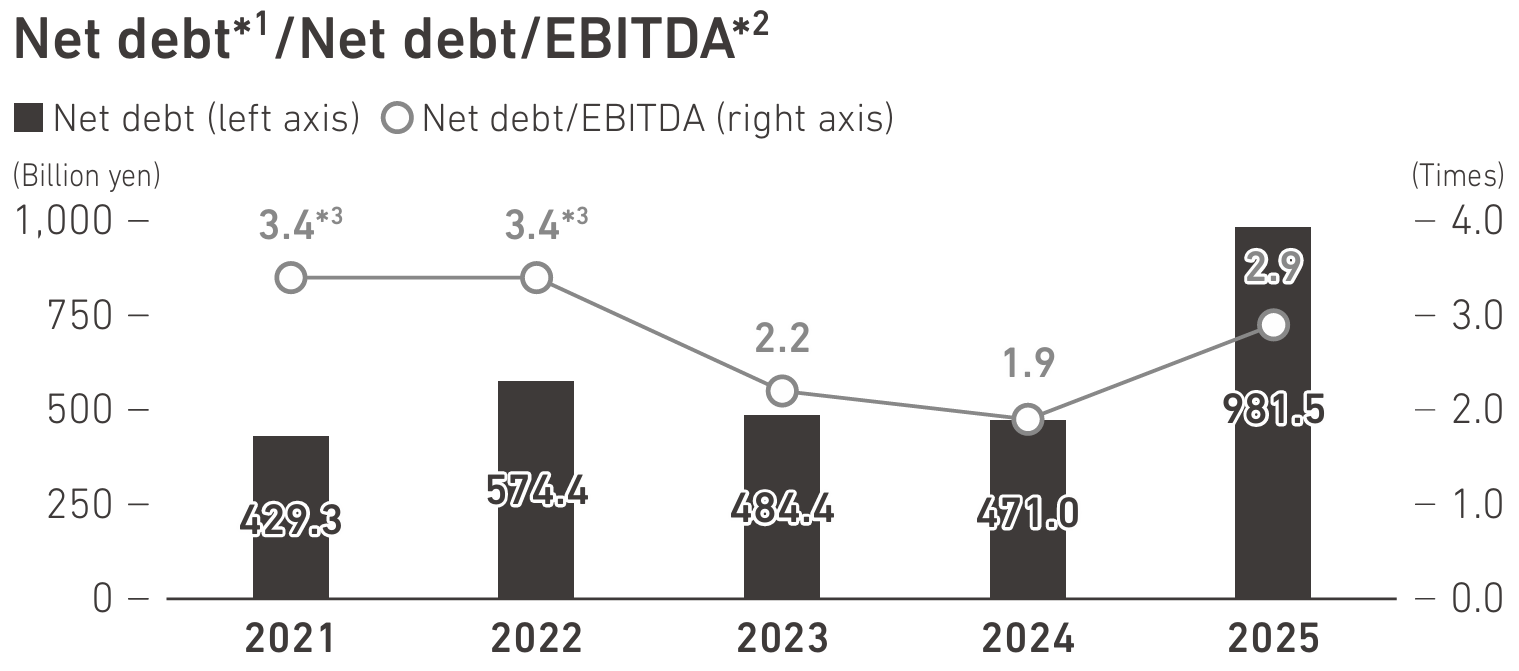
Increase of debt financing for active M&A Net debt generally trends downward under normal circumstances, supported by our low capital expenditure requirements and strong cash generation. However, in 2025, it increased due to borrowings associated with the execution of M&A. Net debt/EBITDA also rose in 2025, primarily reflecting the increase in net debt.