Our Approach to Maximizing PER
EPS (earnings per share) and PER (price-to-earnings ratio) are important indicators in the pursuit of MSV. By advancing a range of initiatives designed to maximize both EPS and PER, the Group aims to realize MSV over the medium to long term.
PER fundamentally reflects capital-market expectations for future EPS growth. Through proactive IR activities, an optimal financial strategy, sustainability initiatives, and the continued accumulation of a track record of high-quality M&A, we seek to strengthen expectations for EPS growth and thereby maximize PER.
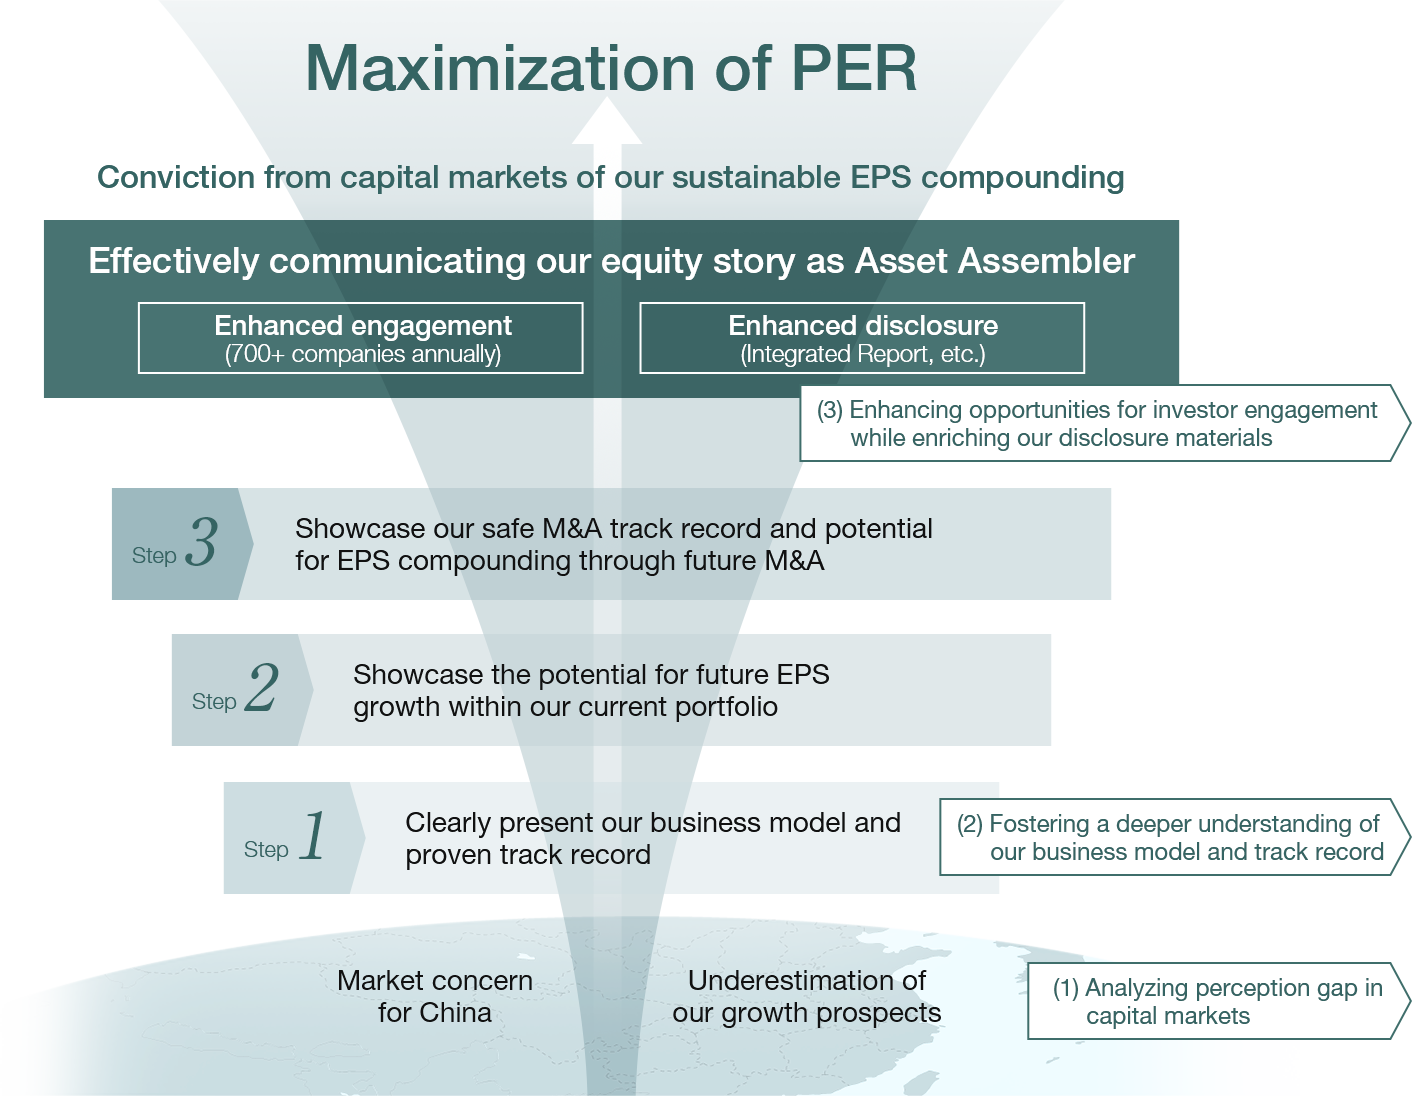
We are working to deepen capital-market understanding of the following three elements that underpin our investment appeal.
Key Points We Want Capital Markets to Understand
-
1
An “EPS Compounder” powered by
both organic growth and M&A - 2 Strong cash generation and disciplined capital allocation
- 3 Replicable growth enabled by autonomous and decentralized management
Following the adoption of the Co-President structure in 2021, we developed a 10-year roadmap covering profit, M&A-related figures, financial KPIs, and other key indicators, and have continued to update it as appropriate. The roadmap uses simulations based on multiple variables to assess how we can execute M&A safely and continuously while maximizing shareholder value. Management believes the roadmap is fully achievable.
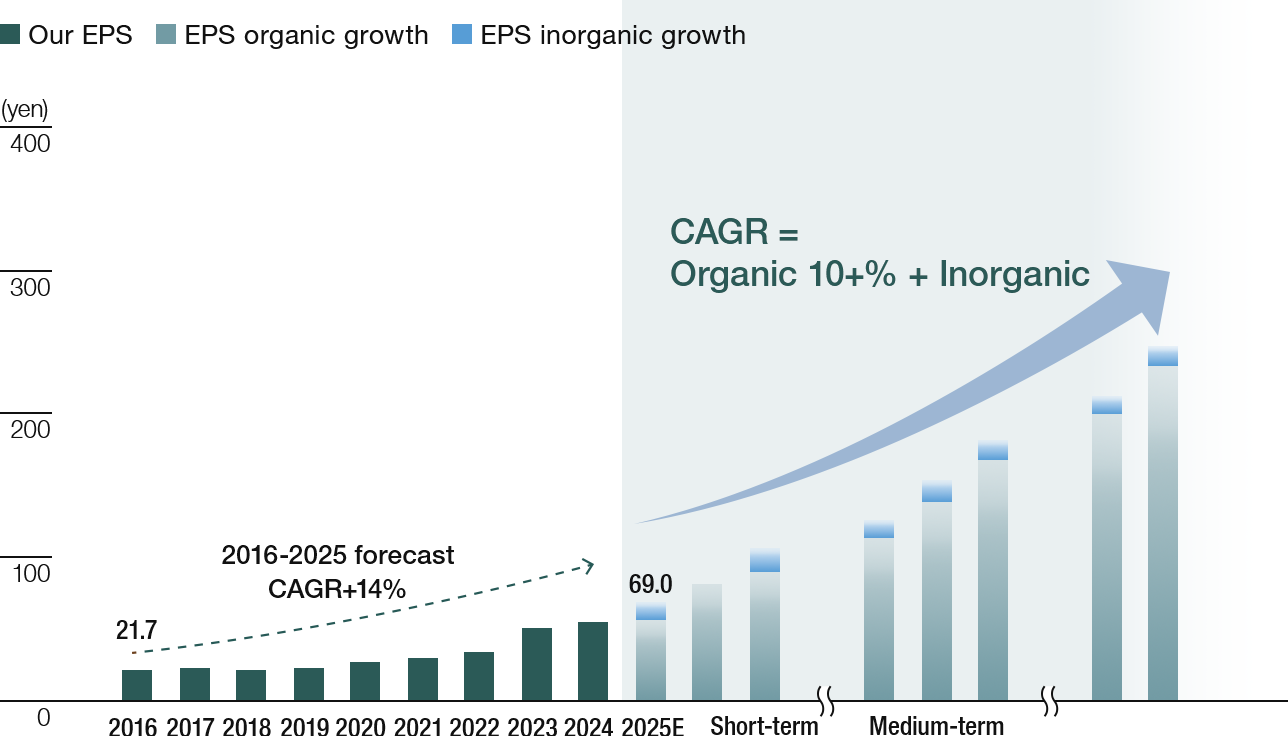
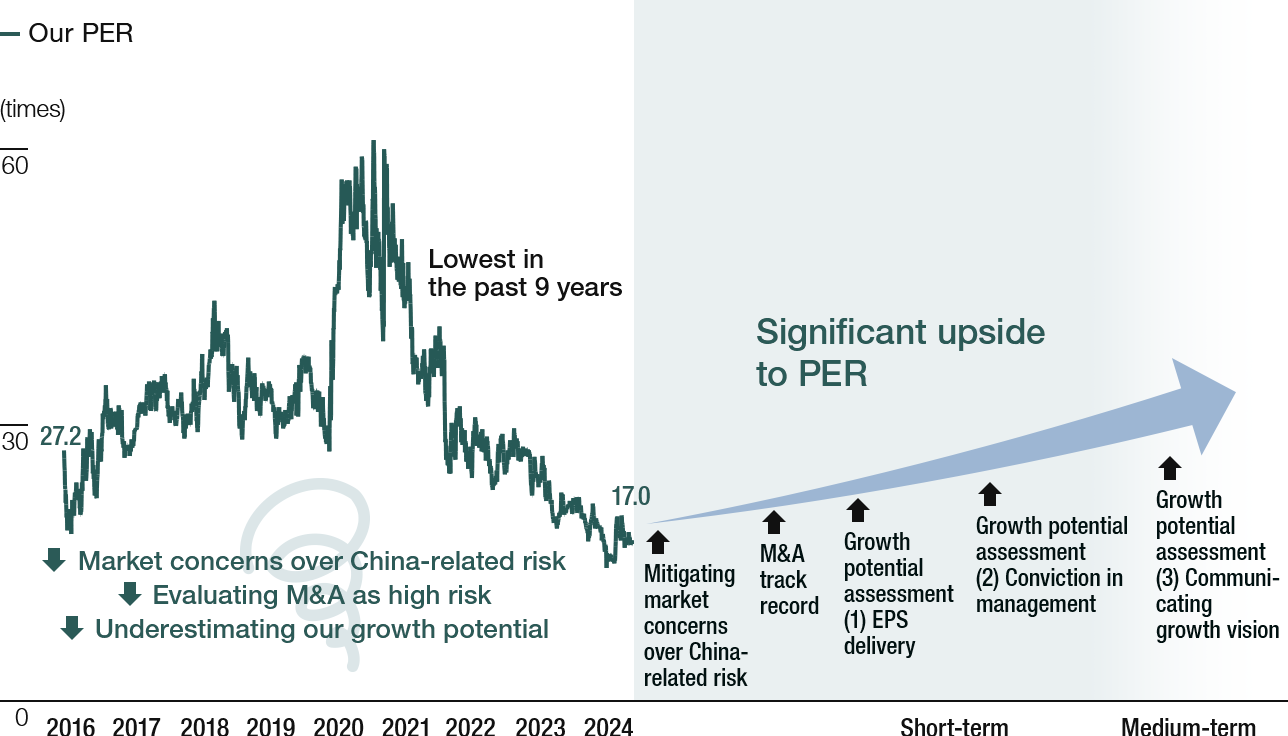
The diagrams below illustrate part of this approach. Figure 1 shows our vision for continuously compounding EPS through organic growth and M&A, while Figure 2 presents the elements we believe are necessary to improve PER. With respect to PER, we are not seeking to enter unprecedented territory. Rather, we are focused on restoring PER as quickly as possible to levels achieved in the recent past.
-
- Figure 1 EPS Track Record
-
-
- Figure 2 PER Track Record
-
Analyzing the Gap with Capital Markets
(1) Analysis of Our Share Price
(Comparison with the TOPIX Chemical Sector and Competitors)
- Despite record-high earnings in 2025, our share price did not fully reflect the growth in our business performance, highlighting the need to close the perception gap with capital markets.
- Breaking down share-price movements into EPS and PER shows that, while EPS has grown steadily, the decline in PER has constrained share-price appreciation.
(2) Correlation Analysis Between Various Indicators and PER
To understand the perception gap with capital markets, we analyze the correlations between PER and various indicators, including revenue growth, ROIC, FCF margin, and FCF/EBITDA. Revenue growth and ROIC show relatively high correlations with PER. Our analysis indicates that we are valued at a discount relative to competitors in terms of “revenue growth × PER,” while we are valued at a premium in terms of “ROIC × PER.” By contrast, the current correlations between FCF-related indicators and PER are low, suggesting that other factors, such as earnings growth and capital efficiency, have a greater influence.
Communicating Our Equity Story
-
(1) Acquisition-Driven Compounder
- Two highly profitable growth drivers: organic growth and M&A
- Strong cash generation and the ability to reinvest at high returns
- An autonomous and decentralized business model and disciplined capital allocation
-
(2) Growth Potential of Existing Businesses
- Existing businesses continue to gain market share and improve profitability, even in challenging market conditions
- Communicating the quality of earnings—their replicability and sustainability—is essential
- Leveraging competitive advantages including strong market share, powerful brands, and extensive distribution channels
-
(3) Replicability and Capital Efficiency of M&A
- Selecting companies with competitive advantages based on rigorous acquisition criteria
- Targeting EPS accretion from the first year and ROIC exceeding WACC by the third year after acquisition
- Pursuing an appropriate balance between capital efficiency and earnings growth
Expanding Dialogue and Enhancing Disclosure
We regularly conduct investor interviews and continue to improve our disclosures and IR initiatives, including the Integrated Report. Based on the opinions and requests received through dialogue with investors, we are working to further enhance disclosure, expand opportunities for engagement, and communicate more effectively the people, voices, and realities of our operations.
-
(1) Enhancing Disclosure Materials
- Disclosure of adjusted profit to present underlying performance
- Disclosure of growth by sales volume, price/mix, and foreign-exchange impact
- Presentation of long-term historical performance and organic/inorganic profit contributions
- Disclosure of company-specific ROIC both including and excluding goodwill and intangible assets
- Presentation of the path to EPS compounding through organic growth and M&A
-
(2) Expanding Opportunities for Dialogue
- Annual IR DAY events since 2024, focusing on topics of strong investor interest
- Direct presentations and Q&A sessions by leaders of each region and business
- Shifting outreach priorities from traditional chemicals and paint-sector investors toward investors focused on EPS Compounders
- Regular visits to global investors in Europe and Canada, in addition to the United States and Asia
-
(3) Communicating People, Voices, and Realities from the Front Lines
- Expanding case studies and basic information on the website and in the Investor Book to complement the Integrated Report
- Using images and videos to communicate sustainability initiatives and the people, voices, and realities of operations
- Holding Investor Tour 2025 to provide firsthand insight into R&D activities and the atmosphere at operational sites
IR Activity KPIs (2020–2025)
| 2020 | 2021 | 2022 | 2023 | 2024 | 2025 | |
|---|---|---|---|---|---|---|
| Number of Investor Meetings | 346 | 519 | 695 | 707 | 806 | 823 |
| (Overseas Investors) | — | — | 384 | 397 | 465 | — |
| (New Investors) | — | — | 118 | 82 | 108 | — |
| (Meetings Led by Co-Presidents) | — | — | 108 | 87 | 109 | — |
| (Roadshows for Share Offerings) | — | — | 121 | — | — | — |
| Liquidity-to-Market-Capitalization Ratio | — | — | 0.18% | 0.17% | 0.16% | — |
| Analyst Coverage | — | — | 7 | 6 | 9 | — |
Note: For 2025, only the number of investor meetings confirmed in Integrated Report 2026 has been added.
IR Activity Plan (2025)
| 1st Quarter | 2nd Quarter | 3rd Quarter | 4th Quarter | |
|---|---|---|---|---|
| Quarterly Results |
|
|
|
|
| Integrated Report |
|
|
|
|
| Domestic Conferences |
|
|
|
|
| Overseas Conferences |
|
|
||
| IR Events |
|
|