Our Sole Mission: Maximization of Shareholder Value (MSV)
Stock-Price Conscious Management
Nippon Paint as a Defensive Growth Stock
We are pursuing MSV, our sole mission, through the maximization of EPS and PER.
We practice management with a stock-price consciousness, which is the outcome of our MSV pursuit.
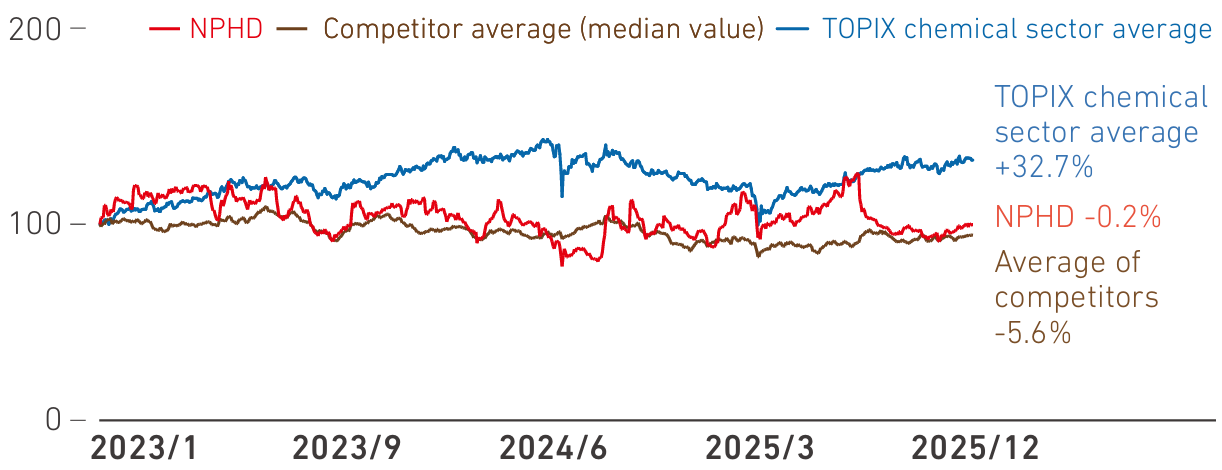
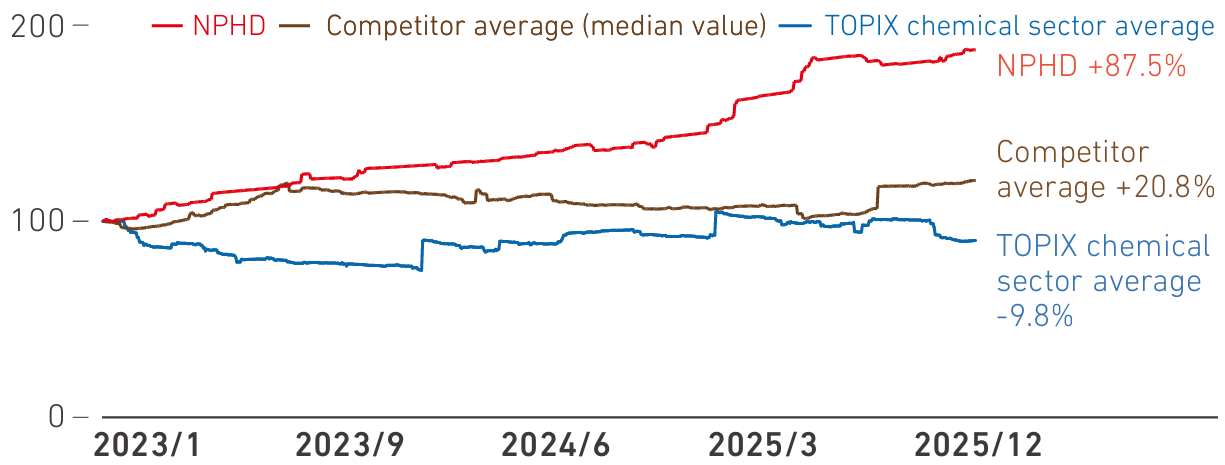
Over the past three years, our share price remained broadly flat despite an 87.5% increase in our EPS.
While this price performance has outpaced the average of our peers, it has trailed the average of the
TOPIX chemical sector. The reason we have continued to deliver record-high earnings, even amid the
recent uncertain macroeconomic environment, lies in our highly competitive business model in the paint
and coatings market, where resilient demand broadly tracks GDP growth across countries. While our shares
exhibit a defensive-growth profile, making them relatively resilient to changes in the external market,
these attributes are not yet fully reflected in our share price. We therefore analyzed the underlying
factors from both a sector and a company-specific perspective.
Trends and Changes in Share Price, EPS, and PER
- Share price trends
-
*1 Source: FactSet, Bloomberg
*2 Indexed to 100 at the start of 2023
*3 Competitor average is based on the average of share prices of the following companies, each indexed to 100 at the start of 2023: Sherwin-Williams, BASF, Asian Paints, PPG, AkzoNobel, Berger Paints, Axalta Coating Systems, SKSHU Paint, Kansai Paint, TOA Paint, and Asia Cuanon Technology
- EPS trends
-
*1 Source: FactSet, Bloomberg
*2 Indexed to 100 at the start of 2023
*3 Competitor average is based on the average of share prices of the following companies, each indexed to 100 at the start of 2023: Sherwin-Williams, BASF, Asian Paints, PPG, AkzoNobel, Berger Paints, Axalta Coating Systems, SKSHU Paint, Kansai Paint, TOA Paint, and Asia Cuanon Technology
- PER trends
-
*1 Source: FactSet, Bloomberg
*2 Competitor average is the average of the following companies: Sherwin-Williams, BASF, Asian Paints, PPG, AkzoNobel, Berger Paints, Axalta Coating Systems, SKSHU Paint, Kansai Paint, TOA Paint, and Asia Cuanon Technology
- Rate of change in share price, EPS, and PER
-
1-year performance (2025) 3-year performance (2023–2025) 5-year performance (2021–2025) Change in share price Change in EPS Change in PER Change in share price Change in EPS Change in PER Change in share price Change in EPS Change in PER NPHD +4.5% +30.1% -3.2x -0.2% +87.5% -11.7x -52.4% +130.3% -33.5x Competitor average +10.2% +7.4% +1.9x -5.6% +20.8% -4.2x -20.3% +40.8% -14.1x TOPIX chemical sector average +6.8% -2.5% +1.6x +32.7% -9.8% +6.0x +15.5% +100.3% -13.7x
Analysis of the paint sector (competitor average)
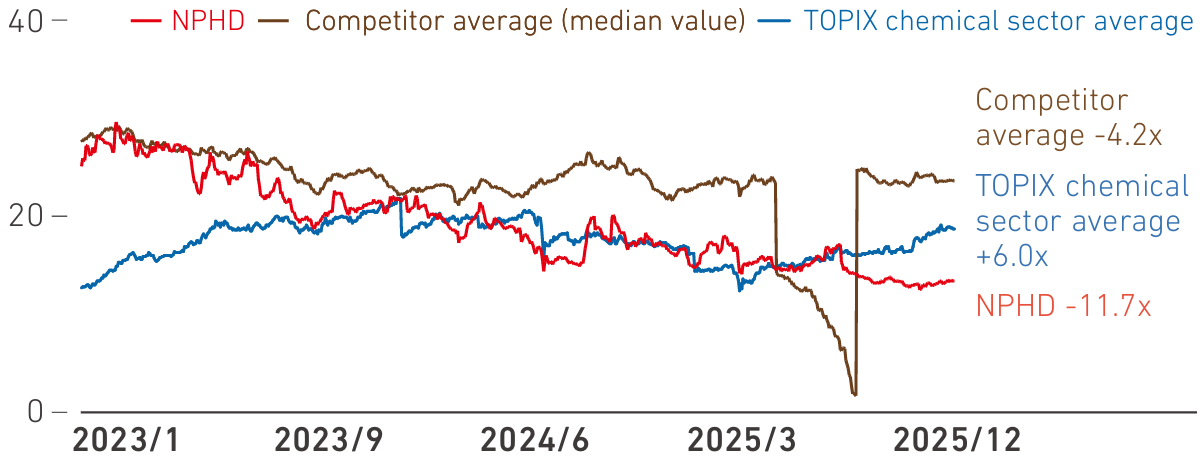
The average share price of the paint sector declined by 5.6% over the past three years. While sector EPS rose by 20.8%, the sector PER fell by 420 bps, which weighed on overall share-price performance. More specifically, earnings growth at major U.S. players has been constrained by a combination of housing market weakness, higher raw material costs resulting from tariffs, and China’s property sector problems. More recently, capital has become increasingly concentrated in AI-related stocks. In this environment, investors have increasingly allocated both time and capital to thematic sectors where returns appear more readily attainable, rather than to the paint sector, which has relatively limited exposure to AI and semiconductors. We have analyzed that this shift in capital allocation is also one of the factors behind the paint sector’s weak share-price performance.
Analysis of our share price
Our share price declined by 0.2% over the past three years. This was due to a 1,170 bps decline in PER, while EPS increased by 87.5%. Specifically, we attribute this to (1) the sector factors discussed in the left-hand column; (2) continued market concern over China-related risks since 2021; (3) an underappreciation of our growth potential; and (4) the market’s views of our proactive M&A stance as high risk. More recently, in relation to our share-price underperformance, the Board has also discussed topics such as EPS growth versus ROIC, focus on the paint business versus expansion into adjacent fields, and how we communicate with the capital markets. We will continue to translate these discussions into concrete actions.
Analysis of Current Situation and Future Direction
As discussed above, while our EPS has increased significantly over time, both the absolute level
of our PER and its rate of change have trended downward relative to the TOPIX chemical sector average
and the competitor average.
The decline in PER reflects a combination of factors. To close this gap with the capital markets and
dispel these perceptions, we are taking steps such as (1) conducting interviews with analysts and
investors in Japan and overseas; (2) analyzing the differences between our Company and both peers
and companies with similar business models; and (3) cultivating new investors based on investor
targeting. Above all, we believe it is essential to accelerate the sustained compounding of EPS
through both organic and inorganic growth and to extend our track record of high growth in pursuit
of MSV.

Correlation Analysis
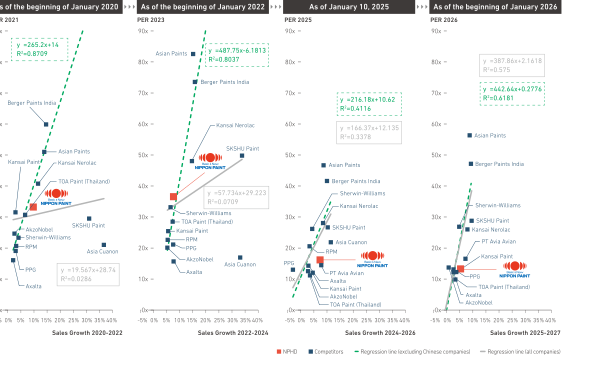
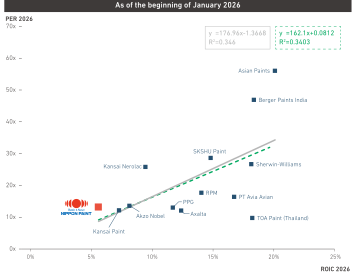
In light of the decline in our PER, we have analyzed its correlation with various indicators. Our analysis indicates that revenue growth and ROIC show a relatively high correlation with PER. Specifically, on a revenue growth versus PER basis, our Company appears to be valued at a discount relative to peers, whereas on a ROIC versus PER basis, we appear to be valued at a premium relative to peers. We believe the premium valuation implied by ROIC versus PER reflects the fact that, while our more proactive approach to M&A than that of our peers affects ROIC, there is also market expectation that companies acquired in line with our Asset Assembler model will continue to operate with high capital efficiency.
1 Revenue growth × PER
Historical data also suggest that revenue growth tends to have a relatively high correlation with PER. As our Company is positioned below the regression line, this suggests that we are valued at a discount relative to peers. The main reasons are that the market is not factoring in our inorganic growth potential—our forecast revenue CAGR based on analyst consensus is +5.2%, well below our actual CAGR of +16.0% over the past seven years—and that NIPSEA China, which has been a major contributor to our growth, is currently perceived as a risk. Our shares appear discounted relative to peers when viewed through the lens of revenue growth. At the same time, we believe there remains upside to our valuation if the market begins to reflect our inorganic growth potential.
2 ROIC × PER
Firms with higher revenue growth, including our Company, tend to be positioned above the regression line, suggesting that we are valued at a premium relative to peers. Investors differ in whether they place greater emphasis on capital efficiency or on growth in revenue or profits. In our case, however, there is a view that the increase in goodwill resulting from proactive M&A offsets improvements in ROIC generated organically, making our ROIC appear lower in peer comparisons. As a result, we believe our valuation is being assigned a premium. It can also be argued that one factor supporting this premium valuation is market expectations for our future capital efficiency, underpinned by the track record of companies acquired in line with our Asset Assembler model maintaining highly capital-efficient operations.
3 FCF margin × PER
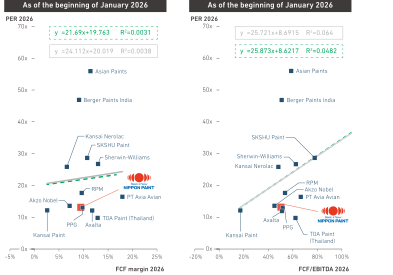
A high FCF margin indicates strong future cash generation capability and is generally regarded as one factor that supports theoretical share value. In general, investors tend to place greater emphasis on cash flow indicators during periods of macroeconomic weakness. At present, however, equity markets remain firm, and the observed correlation is therefore low. We believe the low correlation reflects the influence of other factors, such as revenue growth, investment efficiency, and capital efficiency.
4 FCF/EBITDA × PER
A high FCF/EBITDA ratio indicates a strong ability to convert earnings into cash and is generally regarded as one factor that supports a higher PER. In general, investors tend to place greater emphasis on cash flow indicators during periods of macroeconomic weakness. At present, however, equity markets remain firm, and the observed correlation is therefore low. We believe the low correlation reflects the influence of other factors, such as earnings growth and capital efficiency.