
Font Size
1. Front Cover

Good afternoon, everyone. I’m Yuichiro Wakatsuki, Co-President of Nippon Paint Holdings.
I want to express my sincere appreciation for your time today, as we share our Medium-Term Strategy and outline our roadmap as Asset Assembler.
Today, we are joined by investors, analysts, and members of the press. Thank you all for being here.
2. Executive Summary
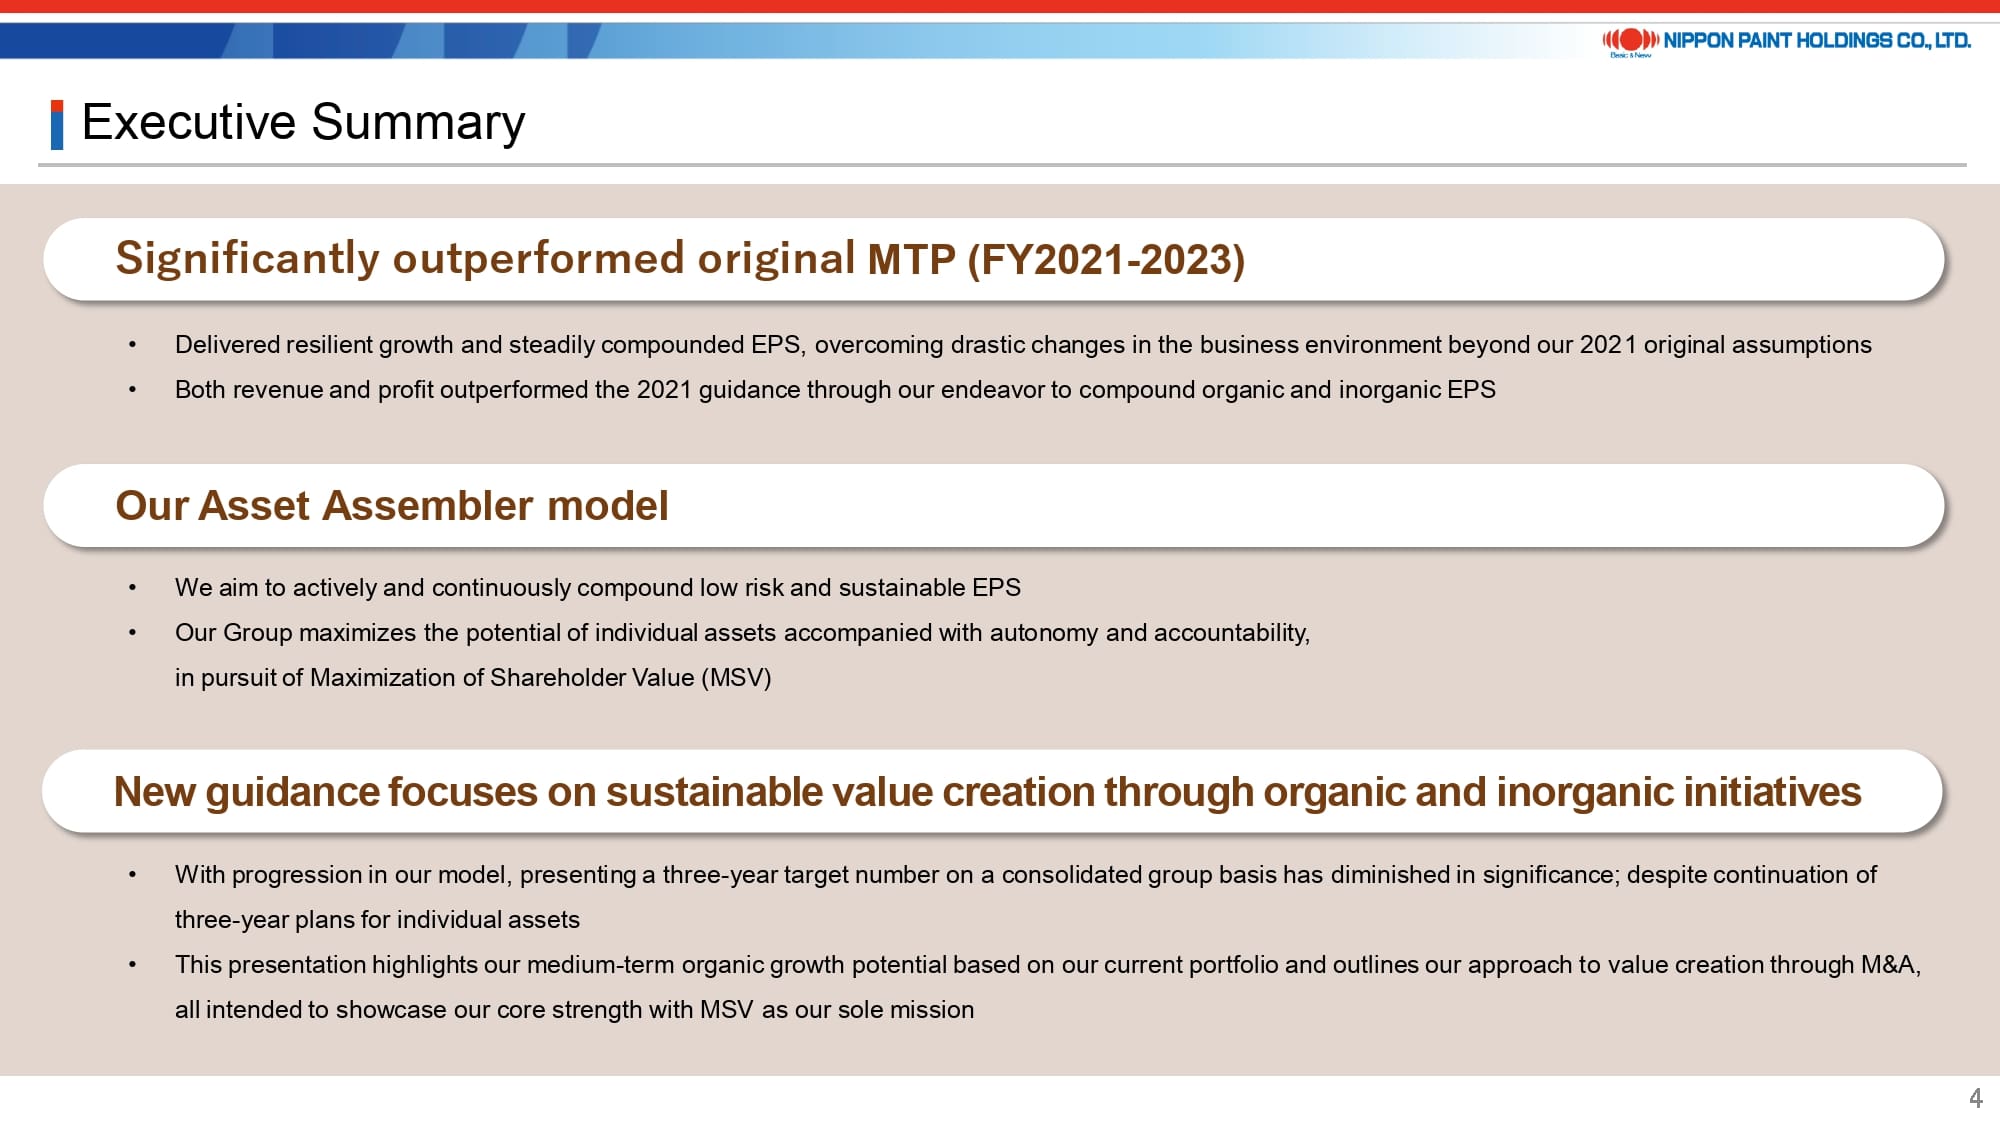
I would like to begin with an executive summary.
Our performance in 2023 significantly outperformed the guidance set out in the previous Medium-Term Plan (MTP) released in March 2021. Specifically, the guidance for 2023 was to achieve revenue of 1,100 billion yen, operating profit of 140 billion yen, and EPS of 45 yen.
Reflecting on the business environment over the past three years, we faced substantial challenges due to external factors. The pandemic’s effects lingered into early 2023, complicating our operations further. Additionally, the global chip shortage and supply chain disruptions significantly impacted many of our industrial products, including automotive coatings. Geopolitical conflicts in various parts of the world, such as in Ukraine, also posed challenges. Concurrently, inflation led to increased prices for raw materials, while a slowdown in the Chinese real estate market affected demand.
Despite these headwinds, we achieved strong growth, thanks to several key factors. These include the robust market demand typical of our businesses, the strength of our brand that supports our leading market share, and our ability to pass on price increases. Furthermore, our growth was bolstered by the strategic addition of excellent assets to our portfolio through M&A activities.
I believe our resilient growth reaffirms the strength of our Asset Assembler model, which, while not ostentatious, is designed to generate sustainable EPS growth through the assembly of stable companies. This model grants autonomy to the outstanding management teams of these companies, coupling it with accountability. We are confident that this approach can maximize the potential of these assets by fostering low-risk, sustainable growth.
As Co-Presidents, we recognize that we may not possess the specific knowledge or expertise required to directly sell paint in local markets such as Australia, China, or Türkiye. However, we firmly believe in our ability to evaluate whether local management teams in these regions are effectively adapting to changes in their business environments, are dedicated to achieving results, and are fulfilling their commitments. Both Co-President Wee and I also serve as Directors of NIPSEA Group and DuluxGroup. Co-President Wee leads the management meetings of each partner company in Japan Group, while I serve as the Board Chair of Dunn-Edwards. This governance structure enables us to unlock the potential of each of our assets. Honestly, I do not believe this model works well with every company. However, we consider it the most efficient and effective model for our Group, given that our businesses are characterized by a low-risk and stable earnings base.
MSV was already our sole mission in the previous MTP. However, starting in 2022, we began to position ourselves as Asset Assembler. The evolution of this model commenced in April 2021, following the appointment of Mr. Wee and myself as Co-Presidents. Throughout its evolution, we have taken various actions, including redefining the role of NPHD as a holding company by spinning off our Japan-focused functional company, beginning in 2022.
We will continue to develop and execute medium-term plans spanning three to four years for each asset, alongside ongoing M&A activities. However, we believe the value of presenting three-year target numbers, as we have previously done to facilitate a proper understanding of our potential, has diminished.
This Medium-Term Strategy briefing today aims to highlight the growth potential of our current portfolio and effectively communicate our approach as Asset Assembler.
3. Nippon Paint at a Glance
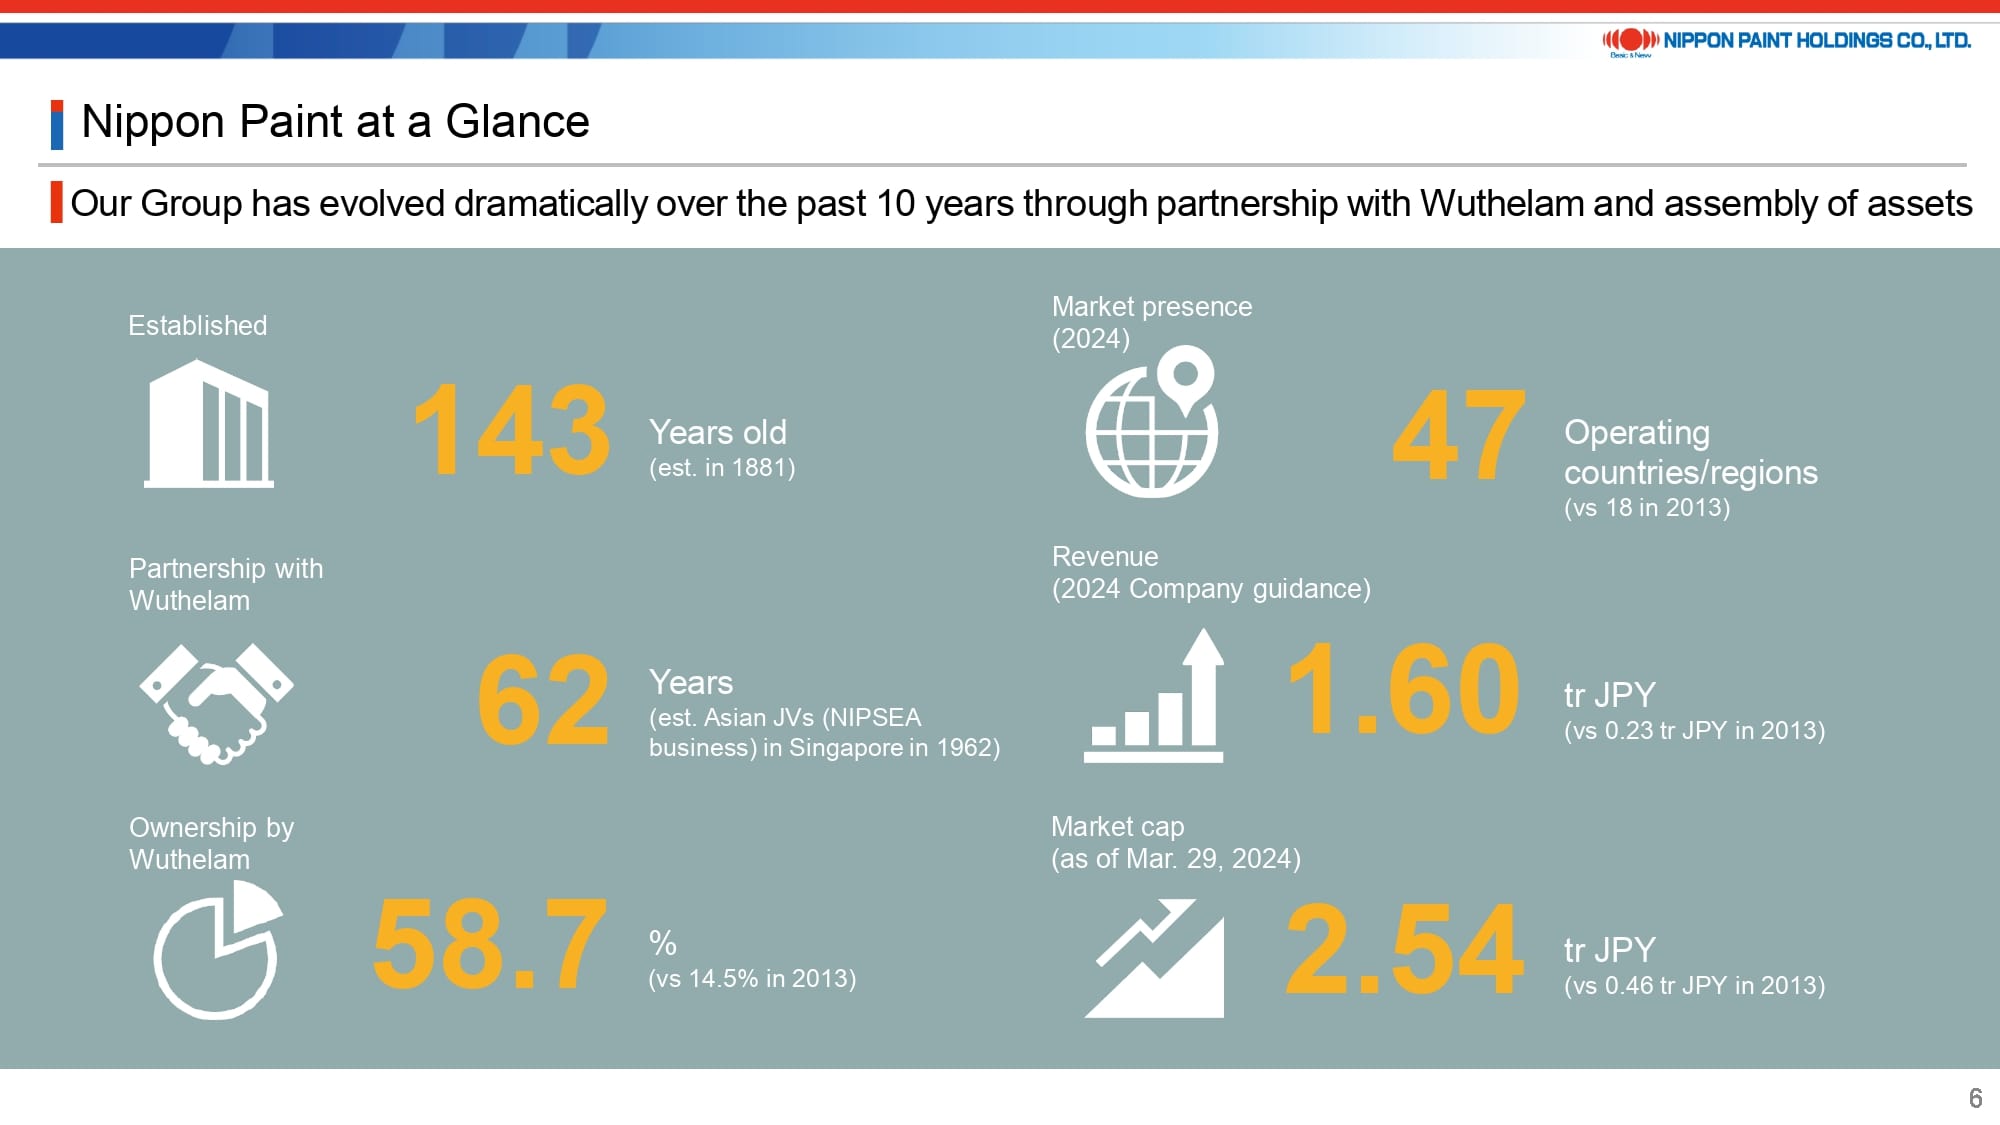
Allow me to provide an overview of our Group once again.
With a history spanning 143 years, our Group’s market presence has expanded from 18 countries and regions a decade ago to 47 countries and regions today. Based on our 62-year-long partnership with our majority shareholder, Wuthelam Group, our revenue and market capitalization have substantially increased compared to a decade ago. We believe we have achieved drastic growth as a long-established Japanese company with a history of 143 years.
4. Our History
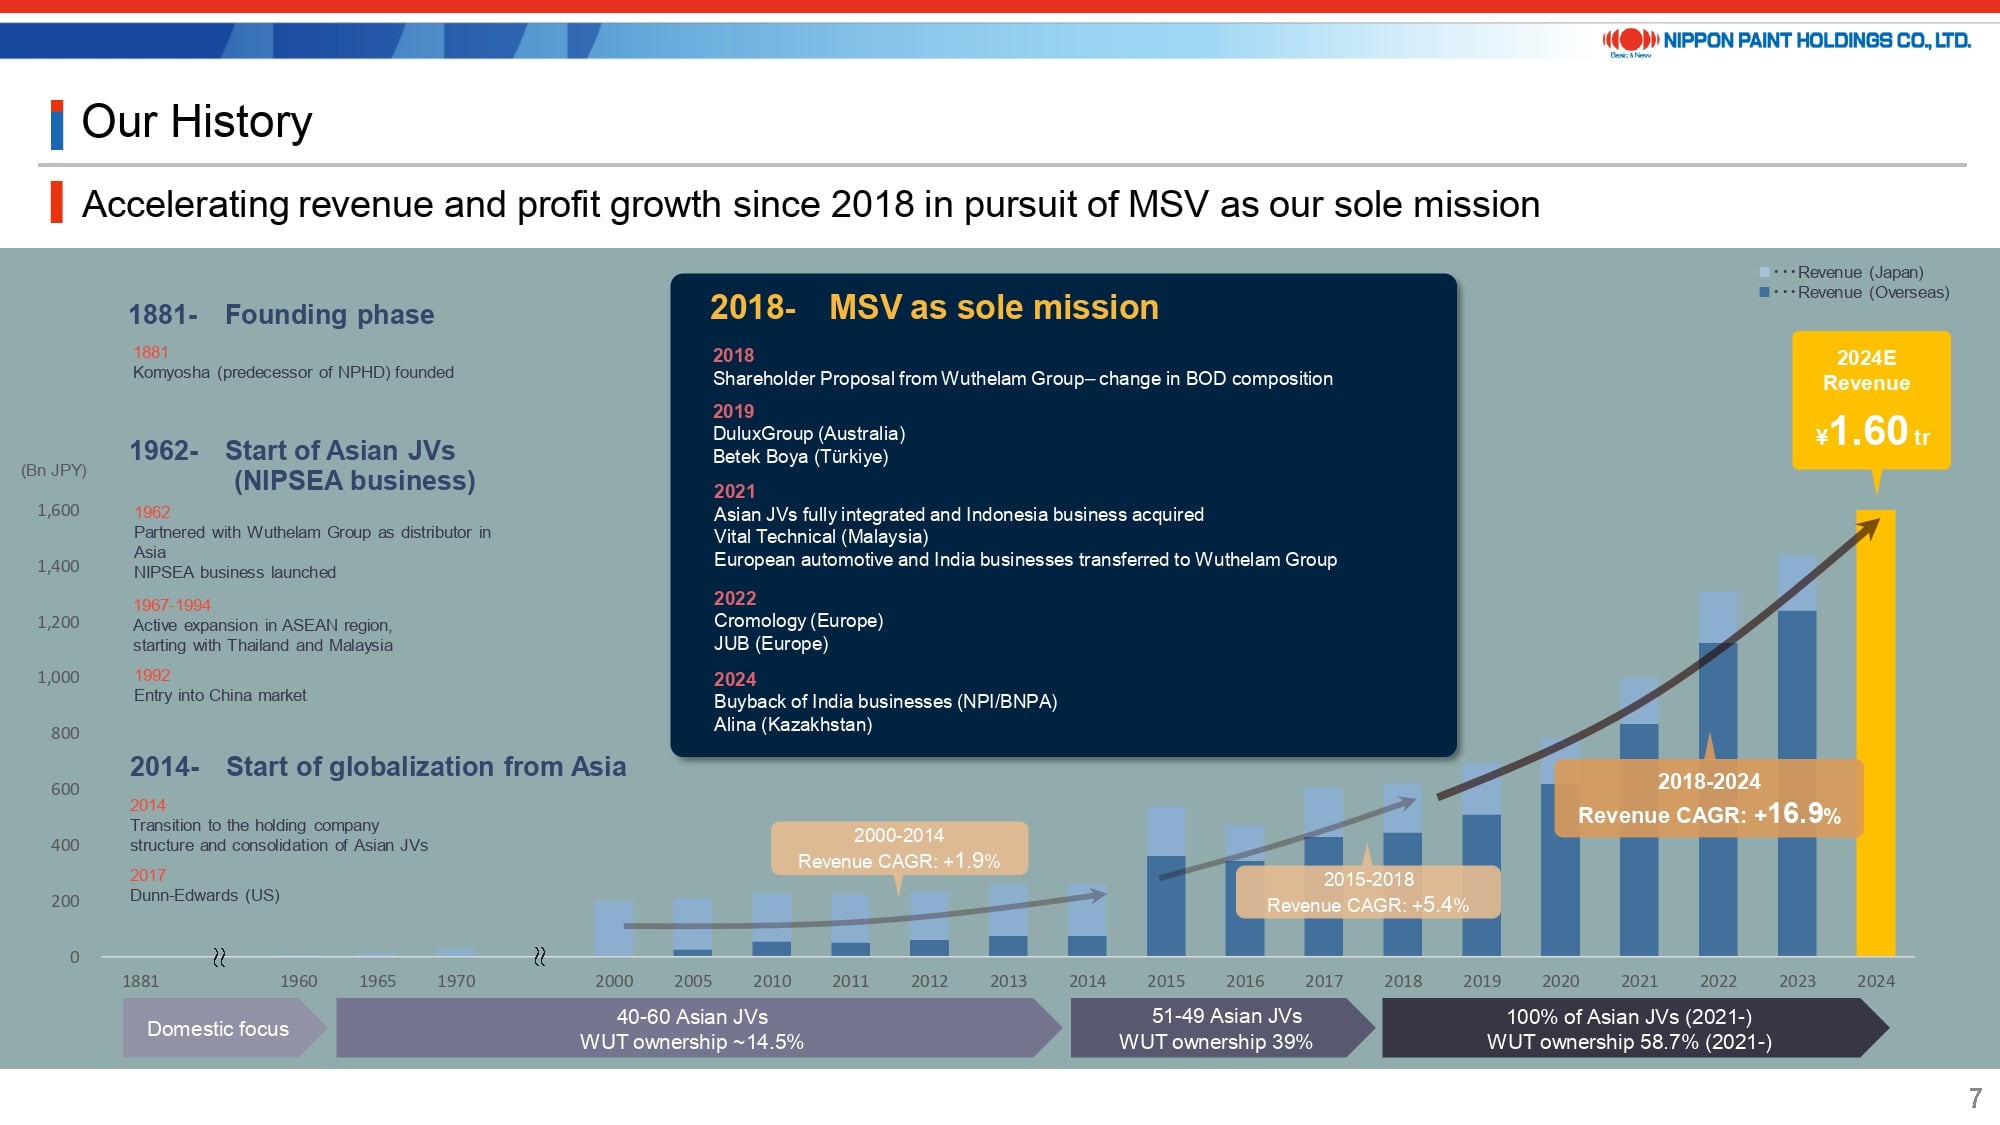
Taking a closer look, we can categorize our history into four distinct phases.
Specifically, these phases include the founding phase starting in 1881 and the initiation of Asian joint ventures (JVs) beginning in 1962. Furthermore, the consolidation of these Asian JVs in 2014 significantly boosted our revenue, from around 250 billion yen to nearly 600 billion yen. This marked the beginning of our globalization efforts from Asia.
I believe the major turning point occurred in 2018, when the composition of our Board of Directors underwent a significant change following a shareholder proposal from Wuthelam Group. It was also during this period that we adopted MSV as our sole mission. Our subsequent M&A activities have focused on low-risk and cash-generative decorative paints companies. In 2021, we achieved a long-standing goal by completing the full integration of the Asian JVs, which subsequently accelerated our growth.
5. Asset Assembler Model
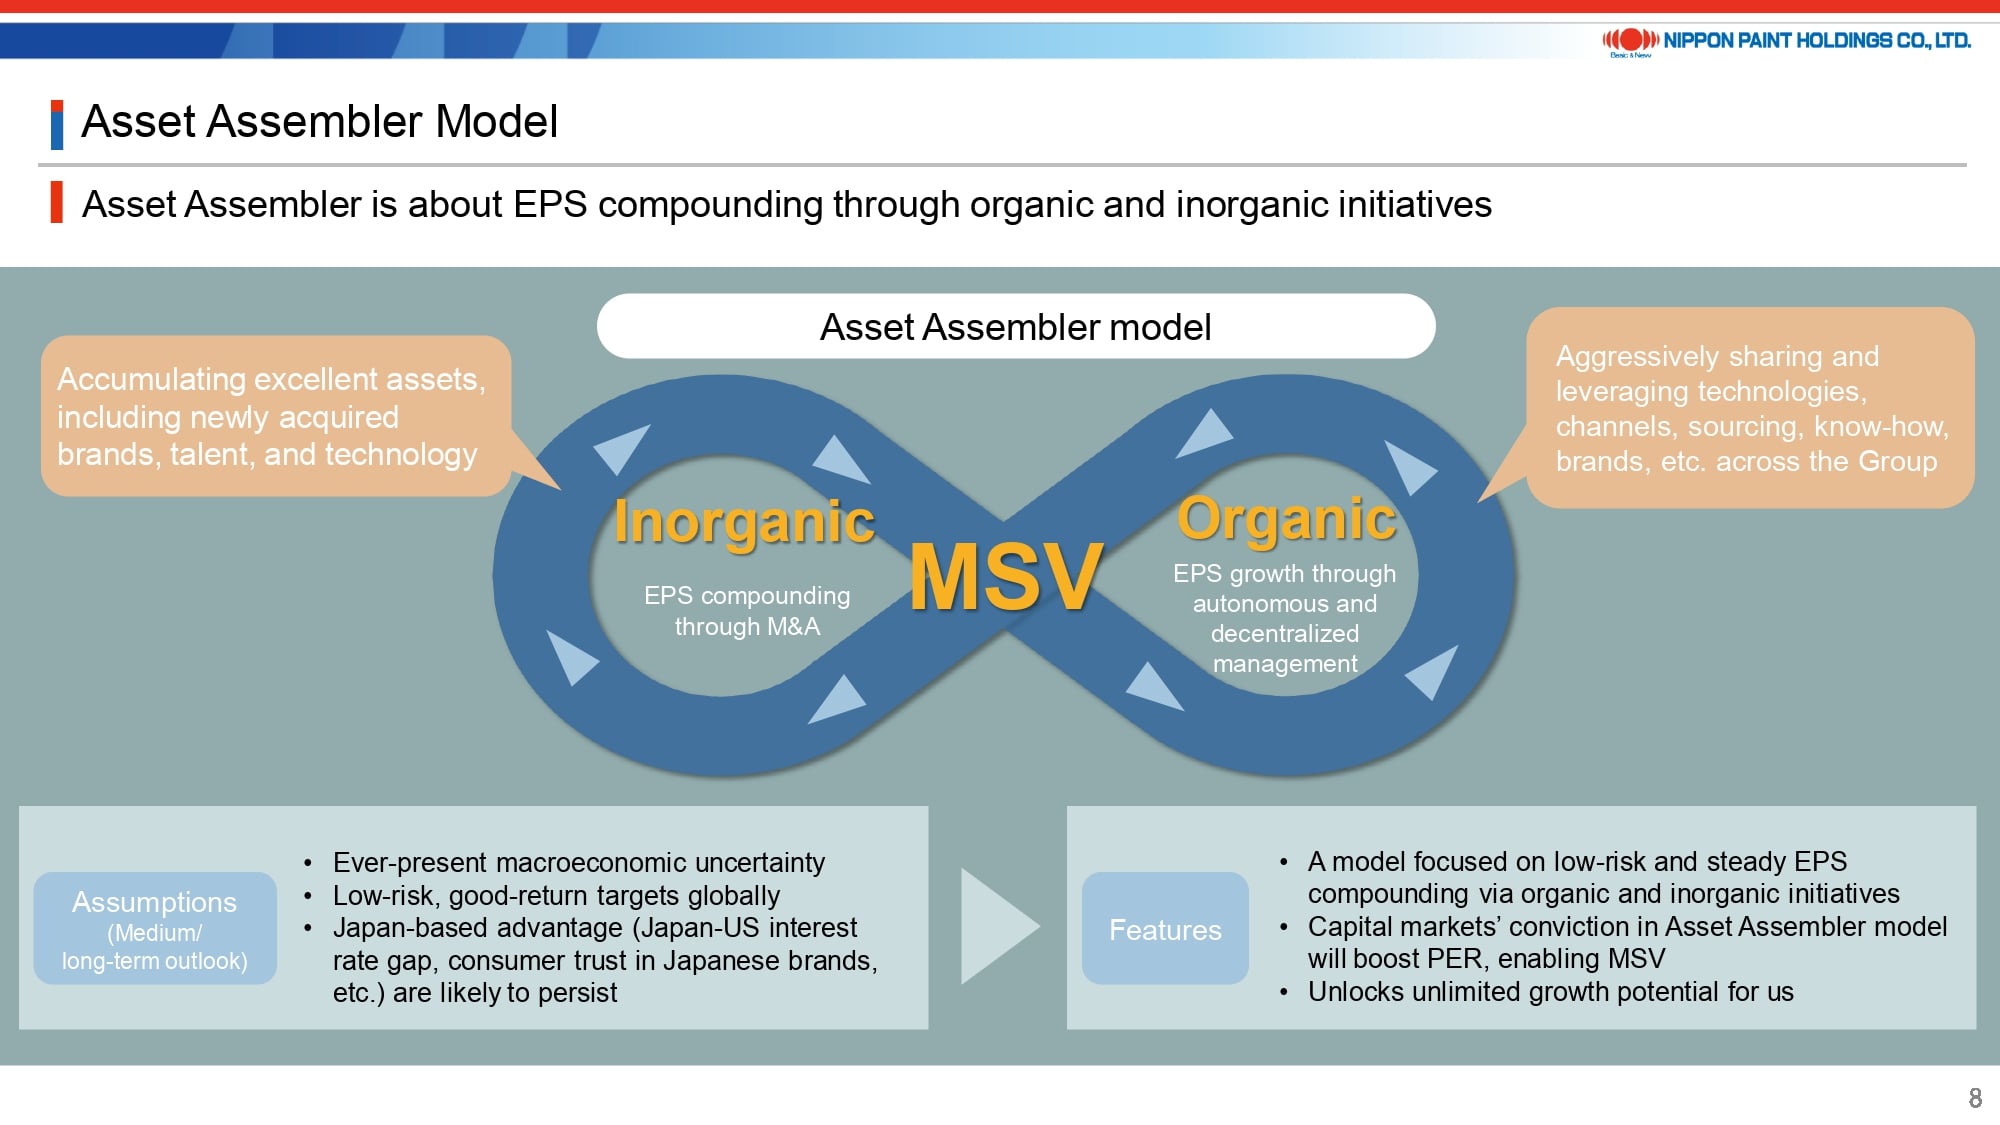
Beginning from page 8, I shall delineate the fundamental elements of Asset Assembler.
The core of being Asset Assembler is to be focused on achieving “Sustainable EPS Compounding” through both organic and inorganic growth initiatives. We are confident that there remains a plethora of global targets that are both low-risk and offer good returns. Moreover, the benefits of being based in Japan—such as access to low-interest borrowing and the high trust placed in Japanese companies as acquirers—are expected to continue. By leveraging our capability to maximize the potential of the assets we acquire, we will also accelerate organic growth, which, in turn, will attract new assets. This positive cycle will offer unlimited upside to our shareholder value.
6. Competitive Advantage of Asset Assembler Model
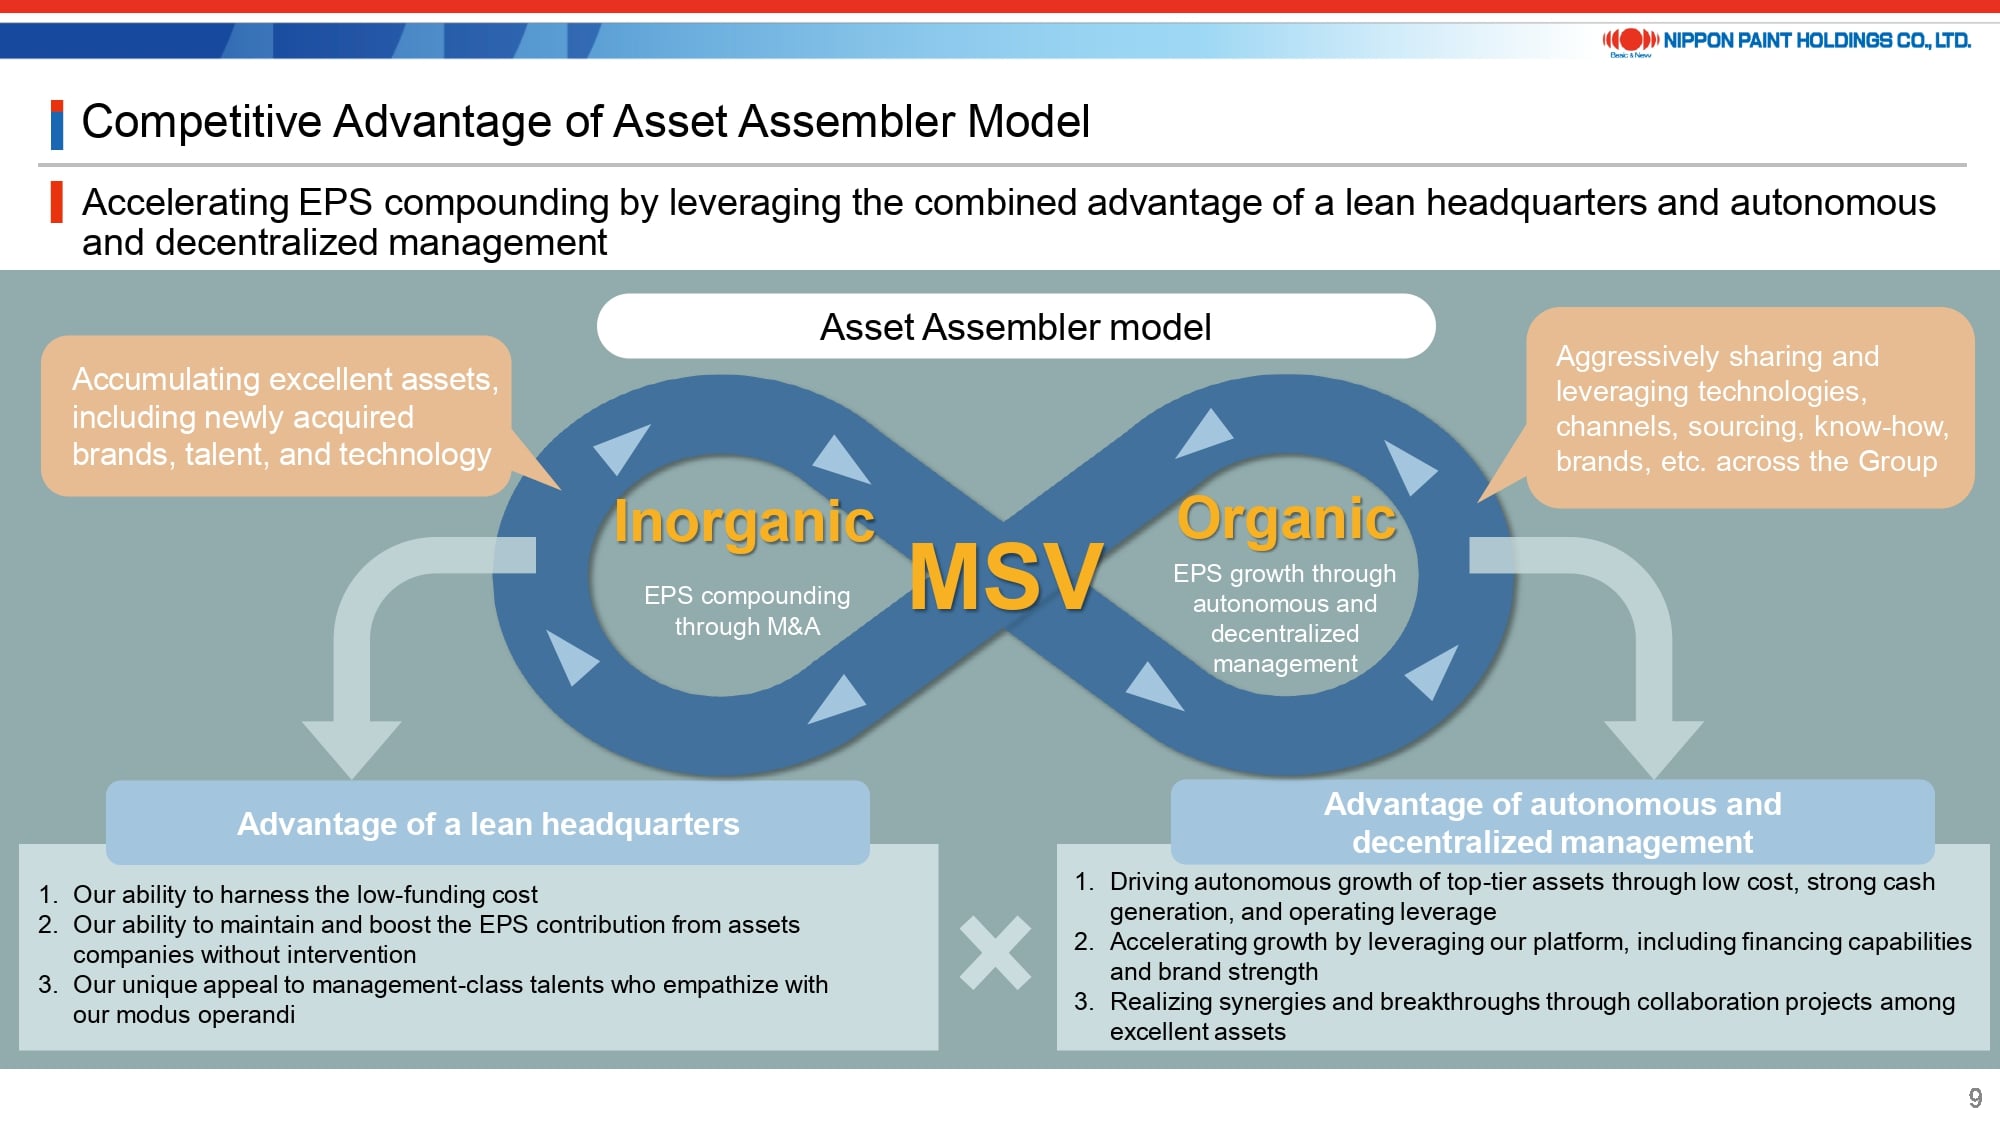
Next, I will explain the competitive advantage of our Asset Assembler model.
While low interest rates benefit all Japanese companies, our distinct advantage lies in our ability and willingness to leverage this boon. By maintaining a lean headquarters, we excel in accumulating valuable assets through identifying low-risk opportunities, securing them at fair valuations, and attracting exceptional talent. We empower this talent with both autonomy and accountability. This talented group aims to enthusiastically leverage the Group’s resources, operating independently of headquarters intervention.
Let me give you an example that demonstrates this approach. Many investment banks, believing that we lack a strong foothold in North America despite its strategic importance, come to us with various M&A proposals. Dunn-Edwards may be a smaller entity in the vast North American market, yet the need to acquire new companies is minimal. This is because Dunn-Edwards consistently achieves revenue growth and maintains profitability, focusing primarily on the West Coast market. Our goal isn’t to secure the top position in the U.S. or on a global scale, but rather to strictly pursue MSV. Regardless of the North American market’s allure, engaging in mergers and acquisitions at any valuation or accepting undue risk goes against our commitment to MSV.
Given this context, our portfolio is not without its imperfections. However, each asset is positioned well enough that its business can thrive in its respective region without needing direct intervention from headquarters. Essentially, our portfolio comprises companies that are capable of autonomously generating cash and contributing to EPS accretion sustainably, without requiring financial support from us. For example, our choice to repurchase the two businesses in India stemmed from our assessment that they had reached the necessary stage for such action.
7. Financial and Non-Financial Targets as Asset Assembler
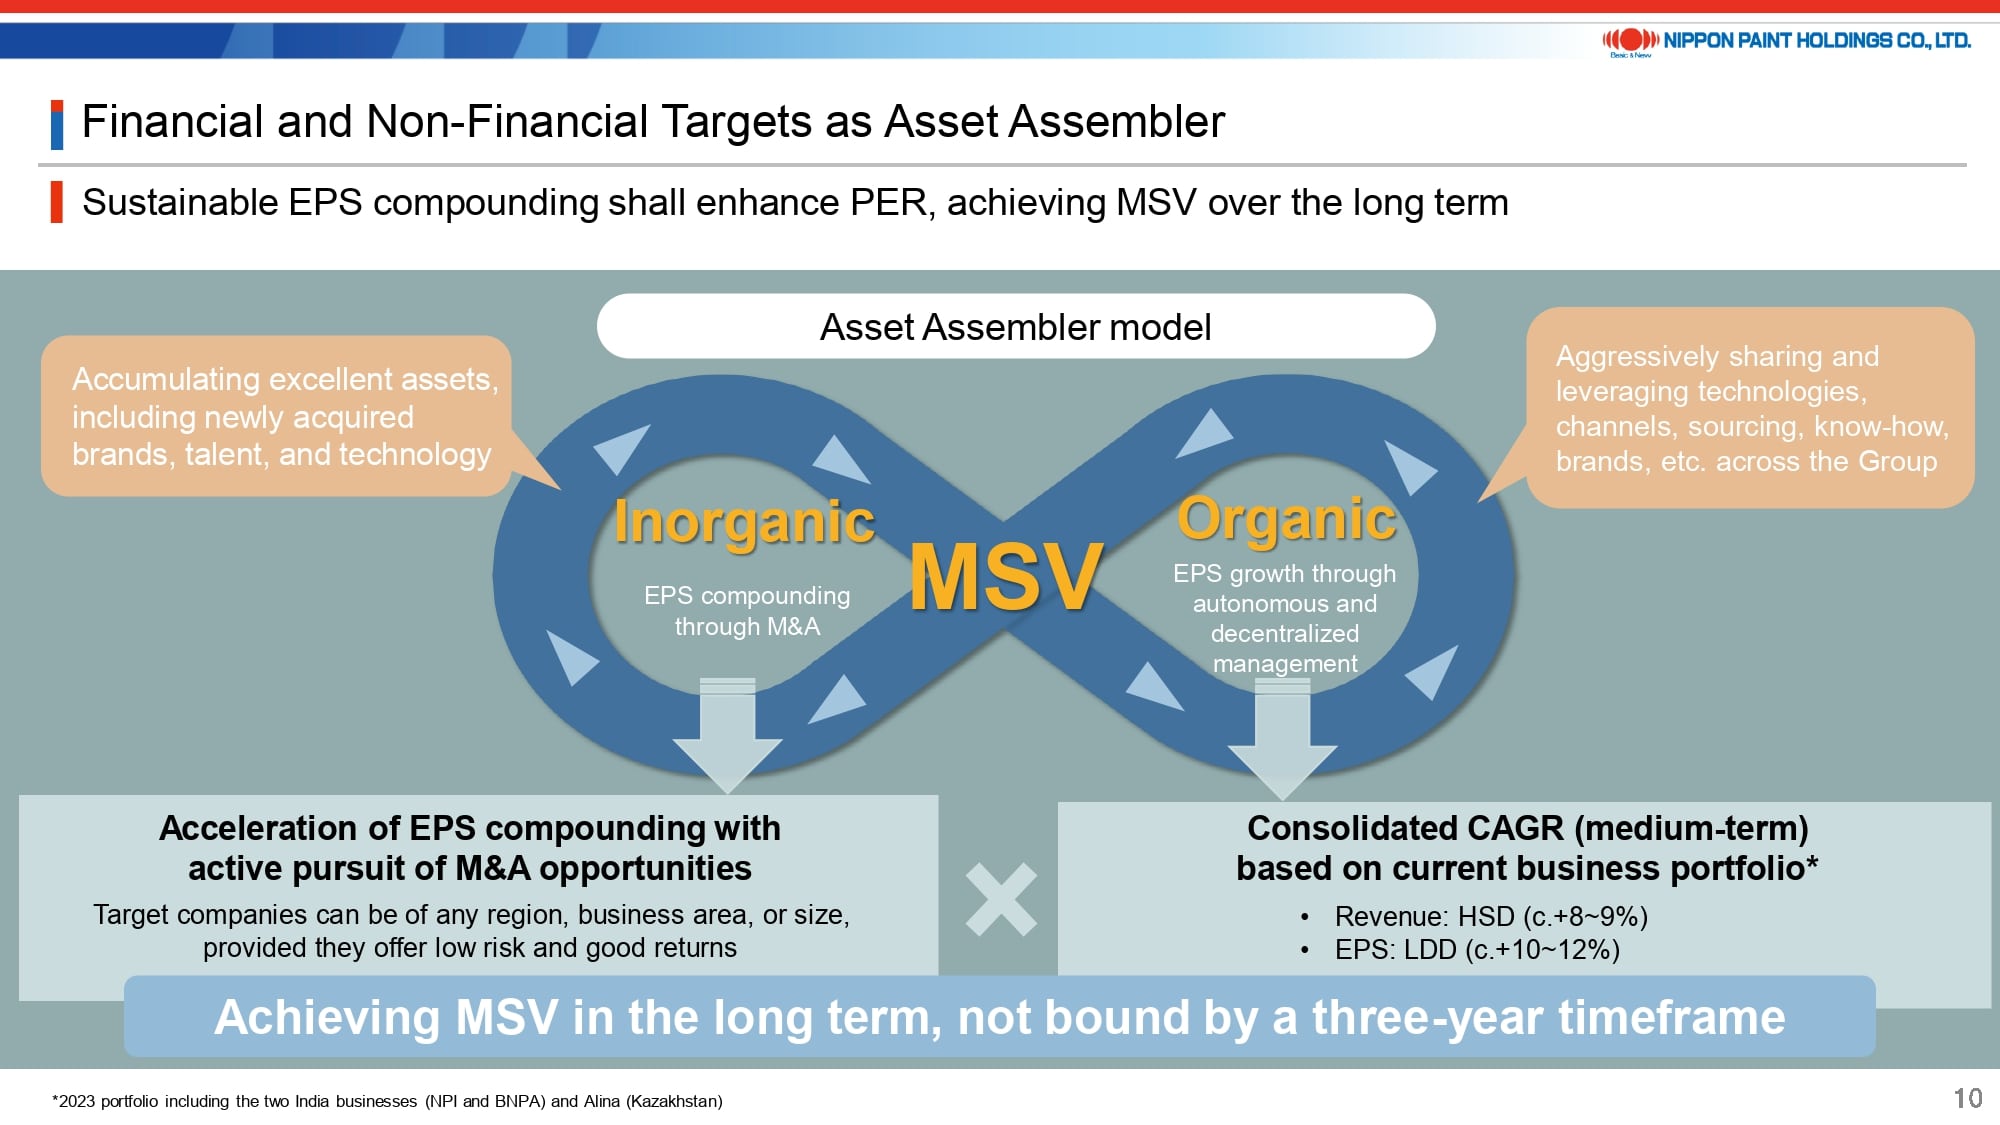
Adopting this strategy, as detailed in the bottom right of page 10 in the presentation, we aim to achieve an annual consolidated revenue growth of 8-9% and an EPS growth of 10-12% over the medium term, based on our existing portfolio.
Simultaneously, as mentioned in the bottom left of the same page, we are committed to pursuing M&As that facilitate low-risk and sustainable EPS compounding. Specifically, our strategy allows for unlimited EPS accumulation by acquiring companies from any region, industry, or size, provided they present low risk and offer good returns.
We are committed to annual growth, aiming to boost performance in the short term while pursuing long-term MSV, instead of confining our objectives to a three-year timeframe.
8. Our Track Record as Asset Assembler
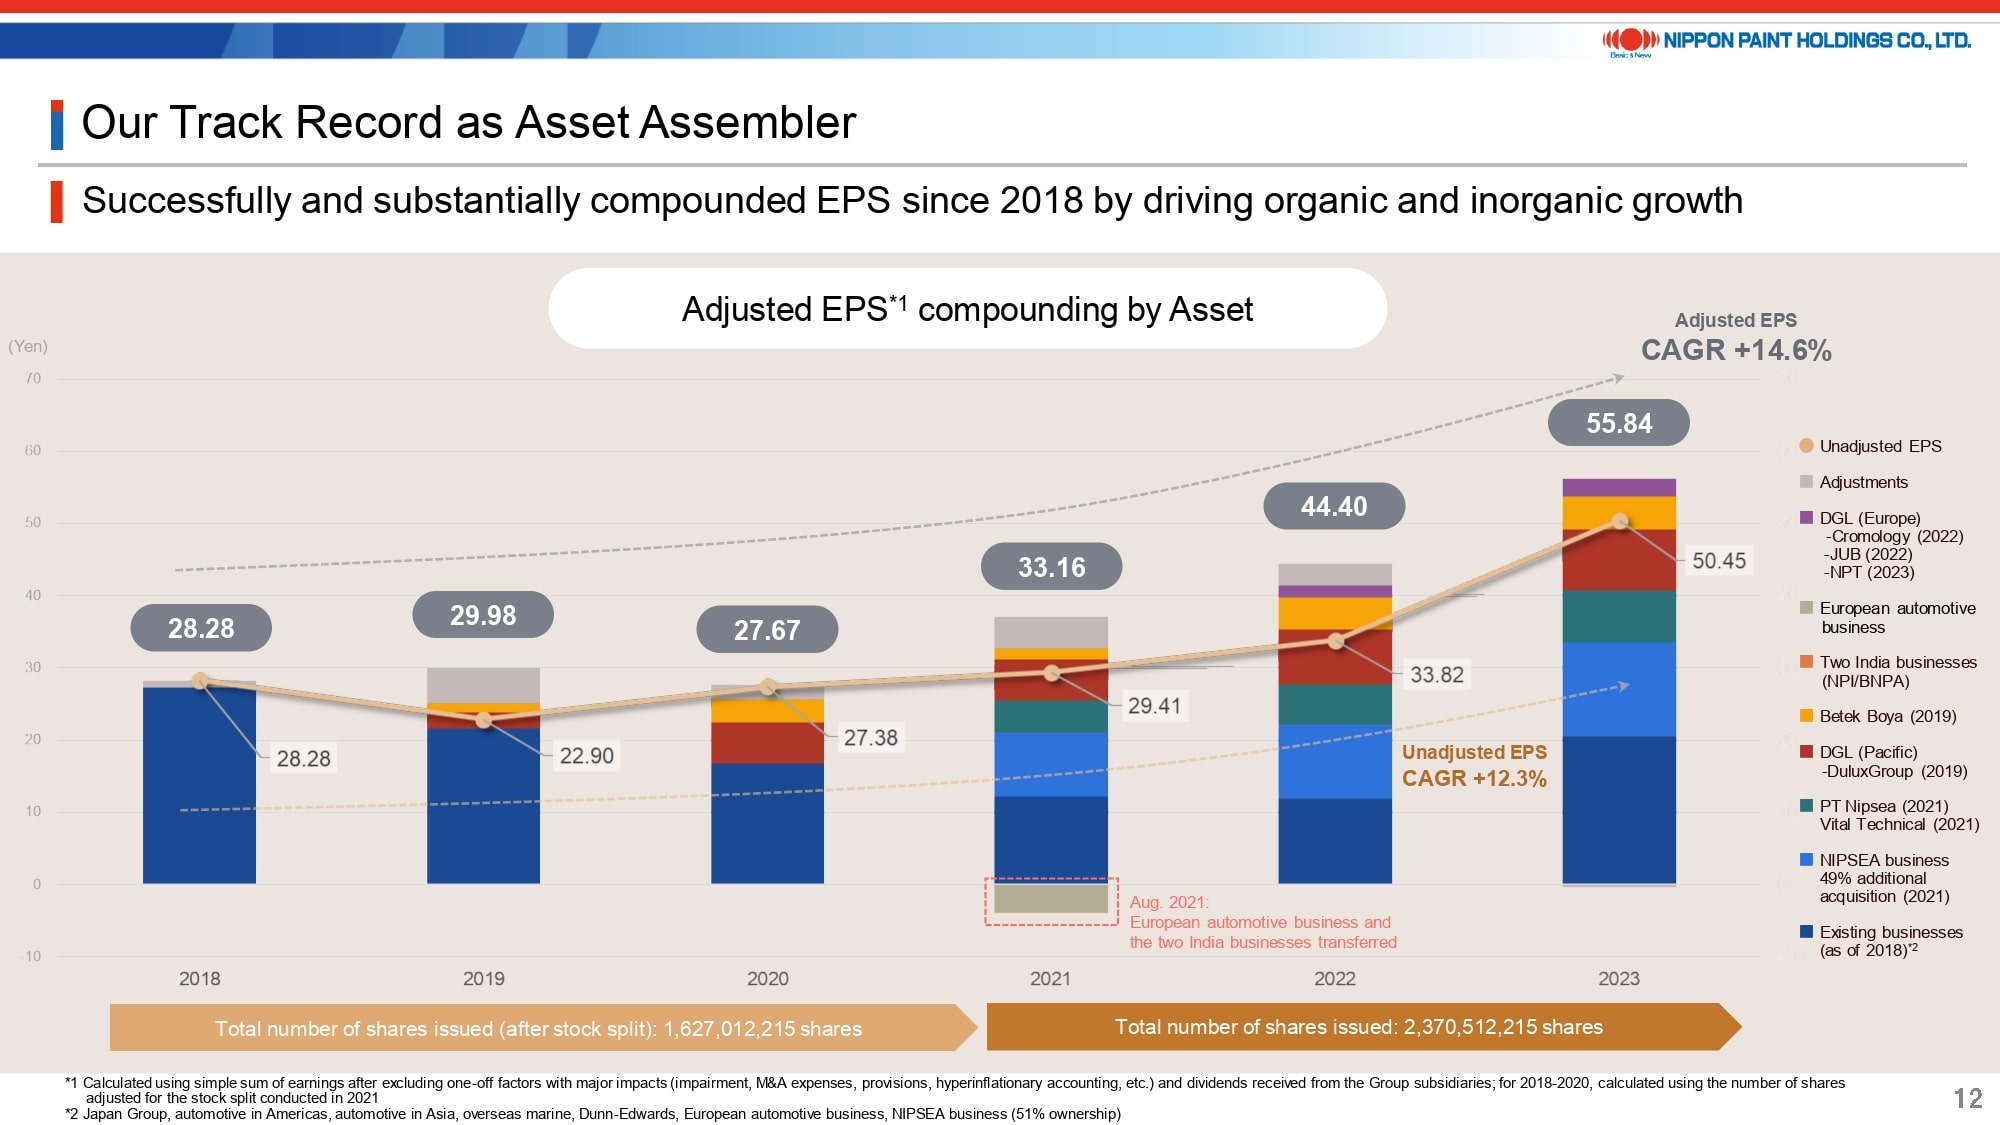
I have outlined our fundamental strategy up to this point. Moving forward, I will delve into our method for compounding EPS.
Page 12 of the presentation illustrates our EPS compounding track record, with adjustments made to exclude special factors for clarity. These adjustments remove the effects of one-off events, such as the impairment of our automotive coatings business in Europe and India in 2019, provisions made in China in 2022, and the impacts of hyperinflationary accounting practices in Türkiye from 2022 onward. We are confident that this will aid in appreciating the underlying strength of our business under normal operating conditions.
In addition, we issued new shares equivalent to approximately 46% of the total number of issued shares, related to the full integration of the Asian JVs and the acquisition of the Indonesia business in 2021. However, as illustrated by the dark blue representing the acquisition of the 51% stake in NIPSEA Group, the light blue representing the 49% stake in NIPSEA Group, and the green representing the Indonesia business, all these acquisitions have contributed to an EPS compounding that exceeds the EPS in 2020.
9. Strong Cash Generation of Assembled Assets
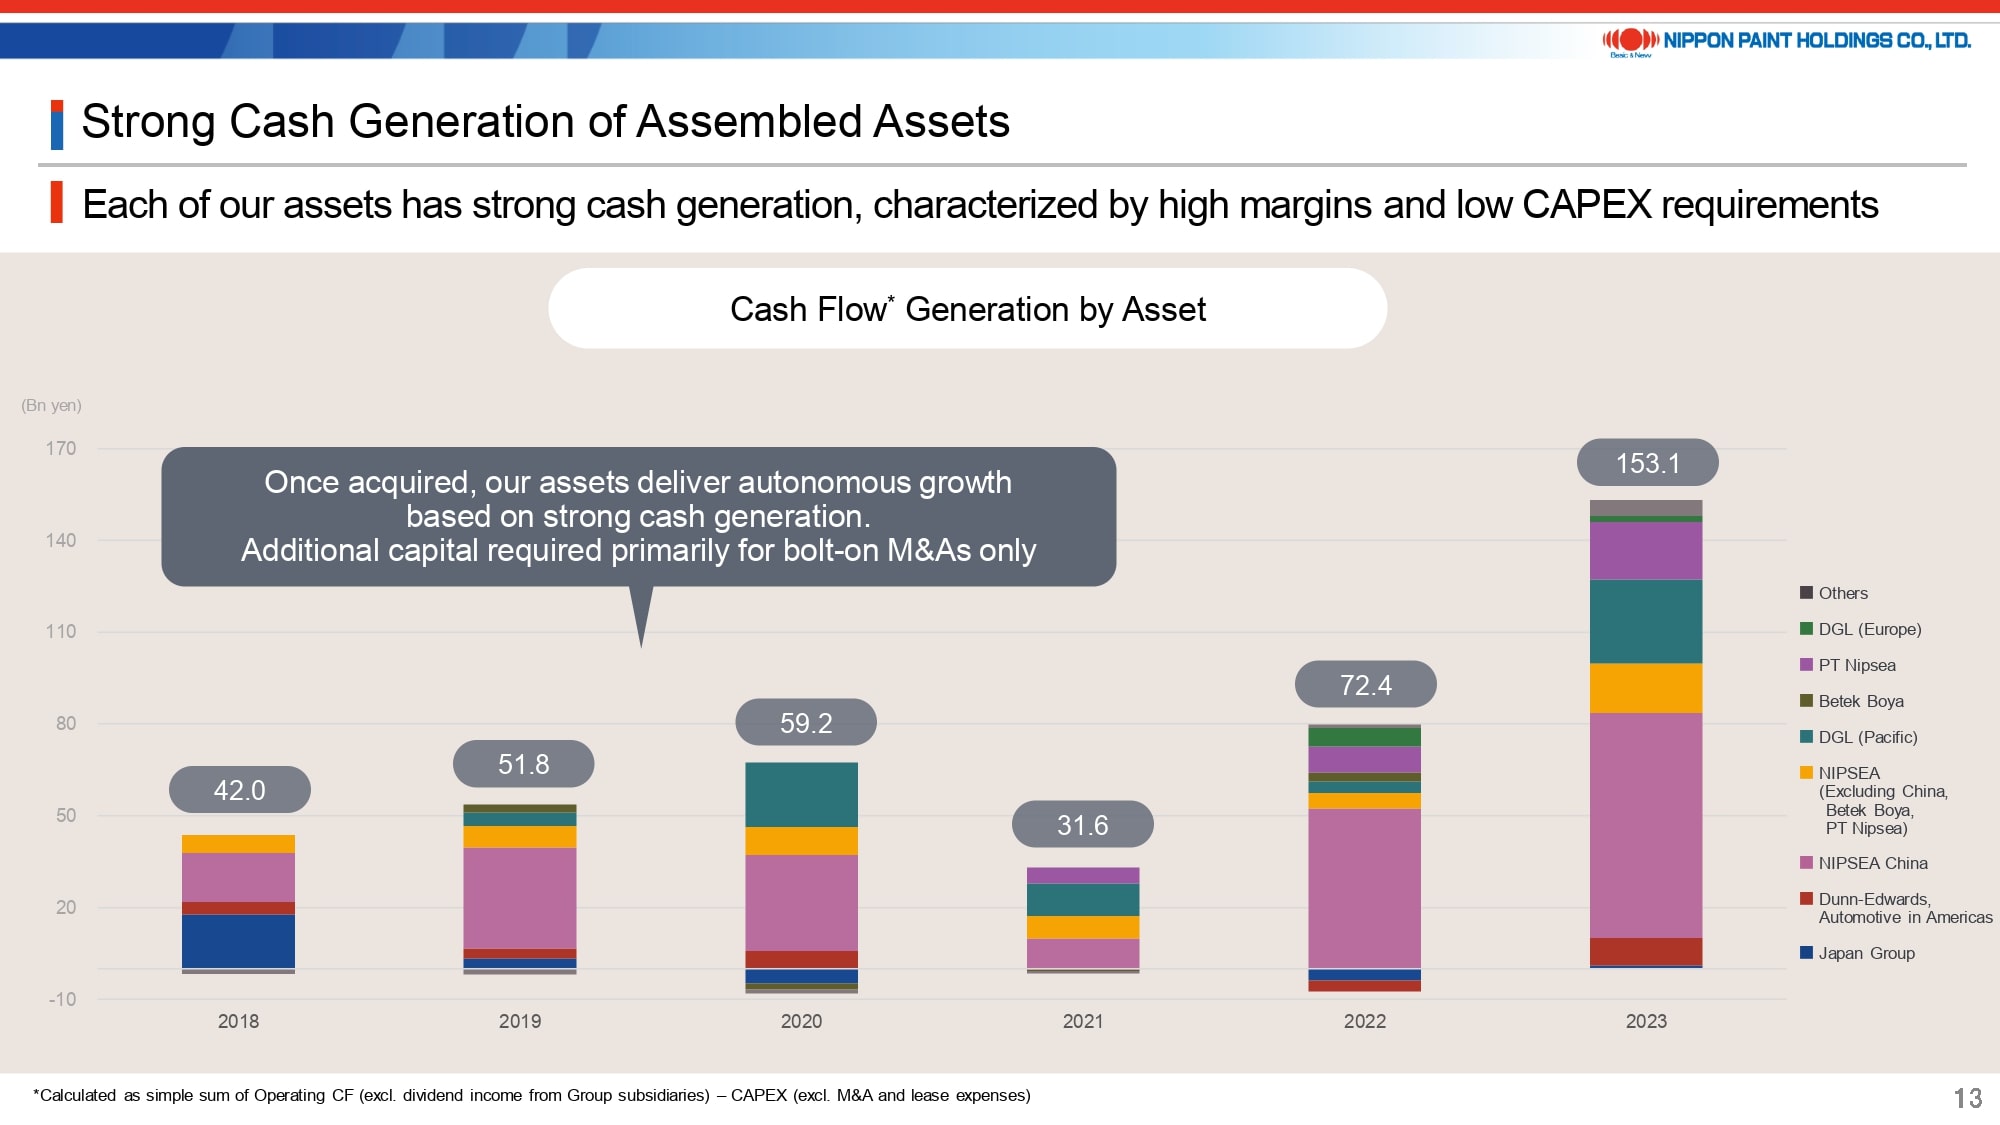
Page 13 shows the cash generation capability of each region, which is being disclosed for the first time. Each graph presents the aggregate amount, which is calculated by subtracting ordinary capital expenditures (excluding those related to M&A) from the after-tax operating cash flows.
In 2023, we successfully generated a substantial amount of cash, partly attributable to a significant improvement in the Cash Conversion Cycle (CCC), which we have defined as a key performance indicator (KPI). We are confident in maintaining a scenario where each asset continues to generate cash, excluding M&A activities, though the amount generated may not match the levels achieved in 2023.
10. Illustrative Operating Leverage Model
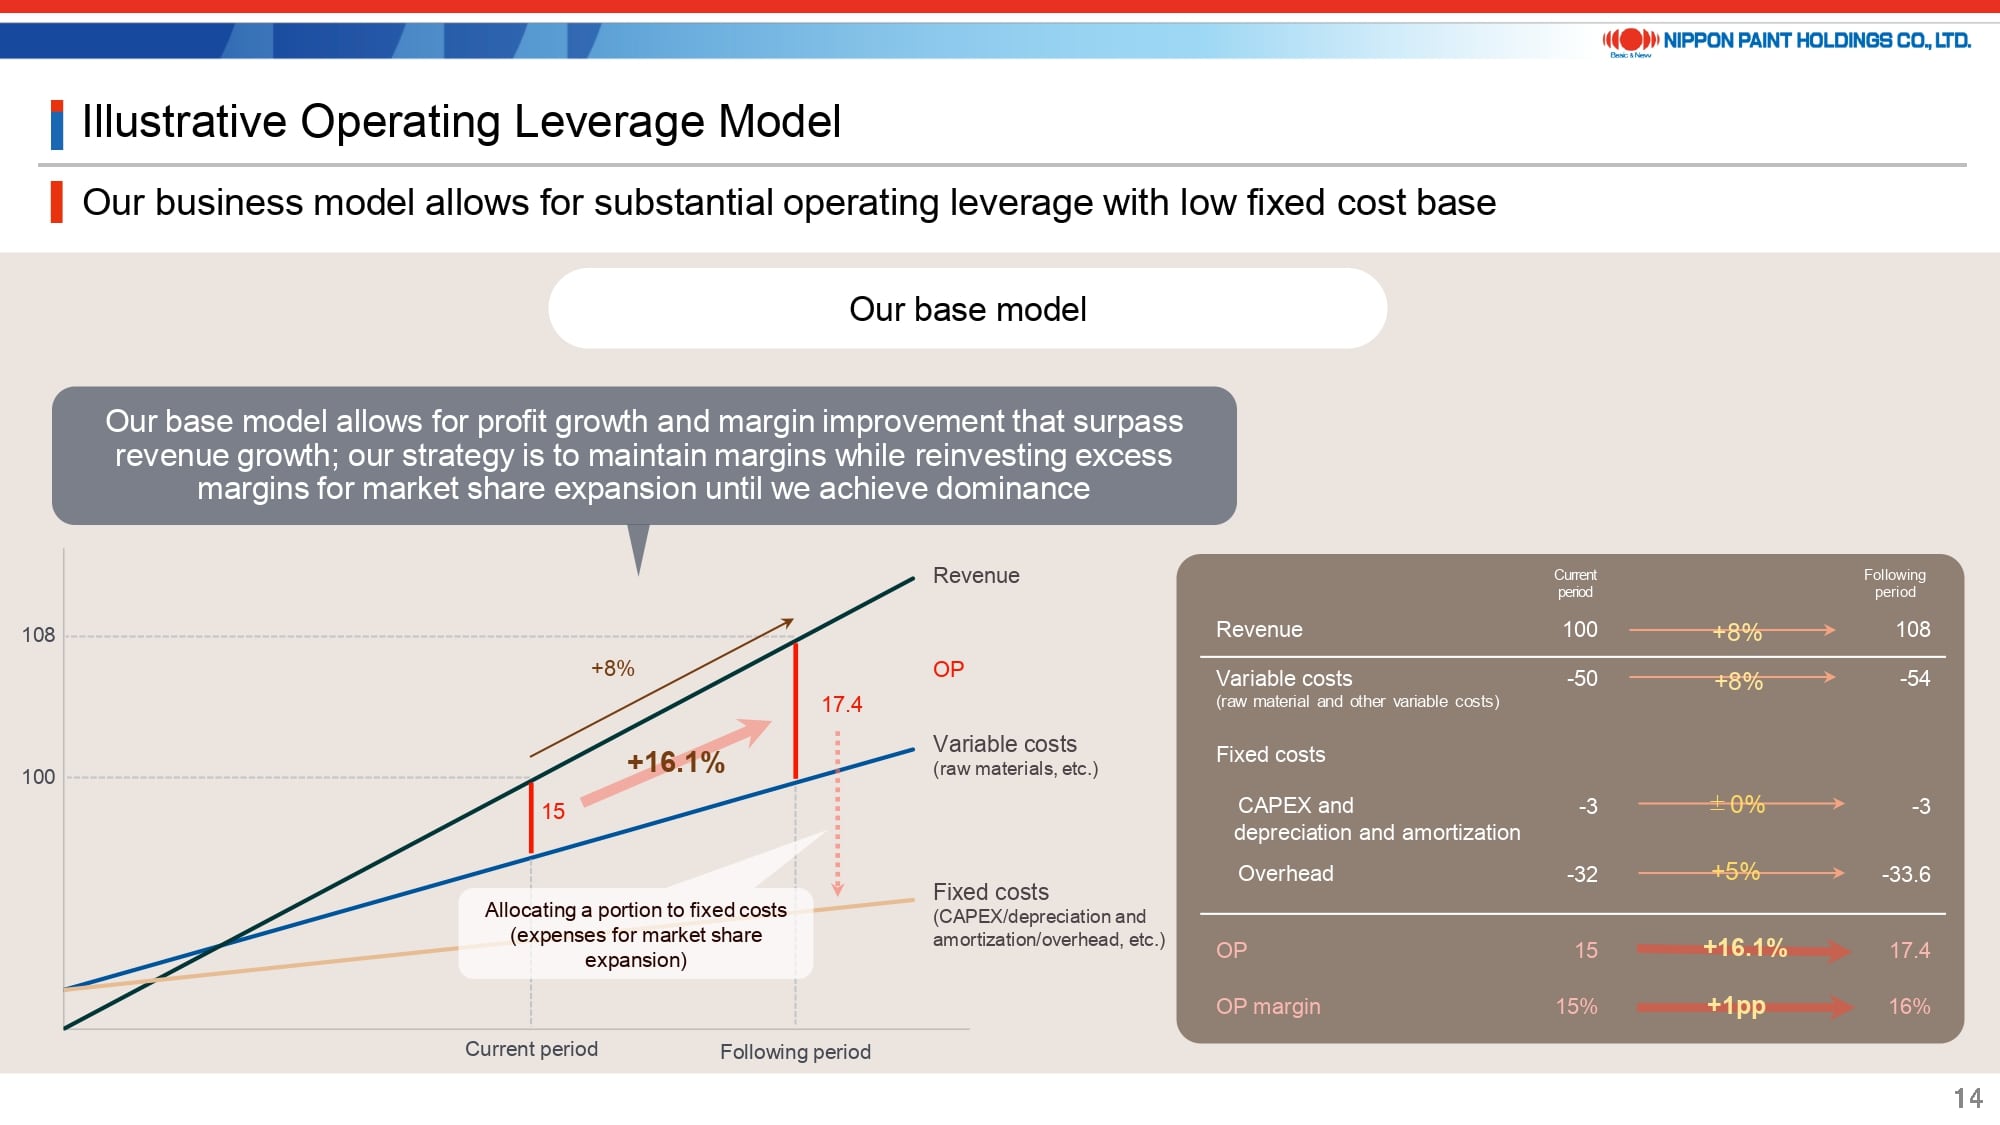
I’ll illustrate the concept of operating leverage by using the paint business as a case study.
While this can vary by region and business, in our base model, variable costs constitute approximately 50% of revenue, and fixed costs comprise about 35%, leading to an operating profit margin of 15%. Under normal conditions, increases in fixed costs and capital expenditures are outpaced by revenue growth. Consequently, an 8% growth in revenue can result in a 16% increase in operating profit.
However, the reason we may not achieve this level of profit growth in reality is due to factors such as fixed costs increasing at a rate comparable to revenue growth, often as a result of inflation. Our strategy involves strategically allocating the excess margins to growth-focused investments, such as advertising, sales promotion, and incentives, with the intention of maintaining margins. These investments are crucial until we achieve market dominance. Additionally, even after achieving market dominance, we may need to continue making growth-focused investments, depending on the competitive landscape.
According to our business model, we have the potential to enhance our margins by ceasing investments. However, it’s important to recognize that this approach would not contribute to long-term MSV.
11. Our Capability as Asset Assembler to Deliver the Promise
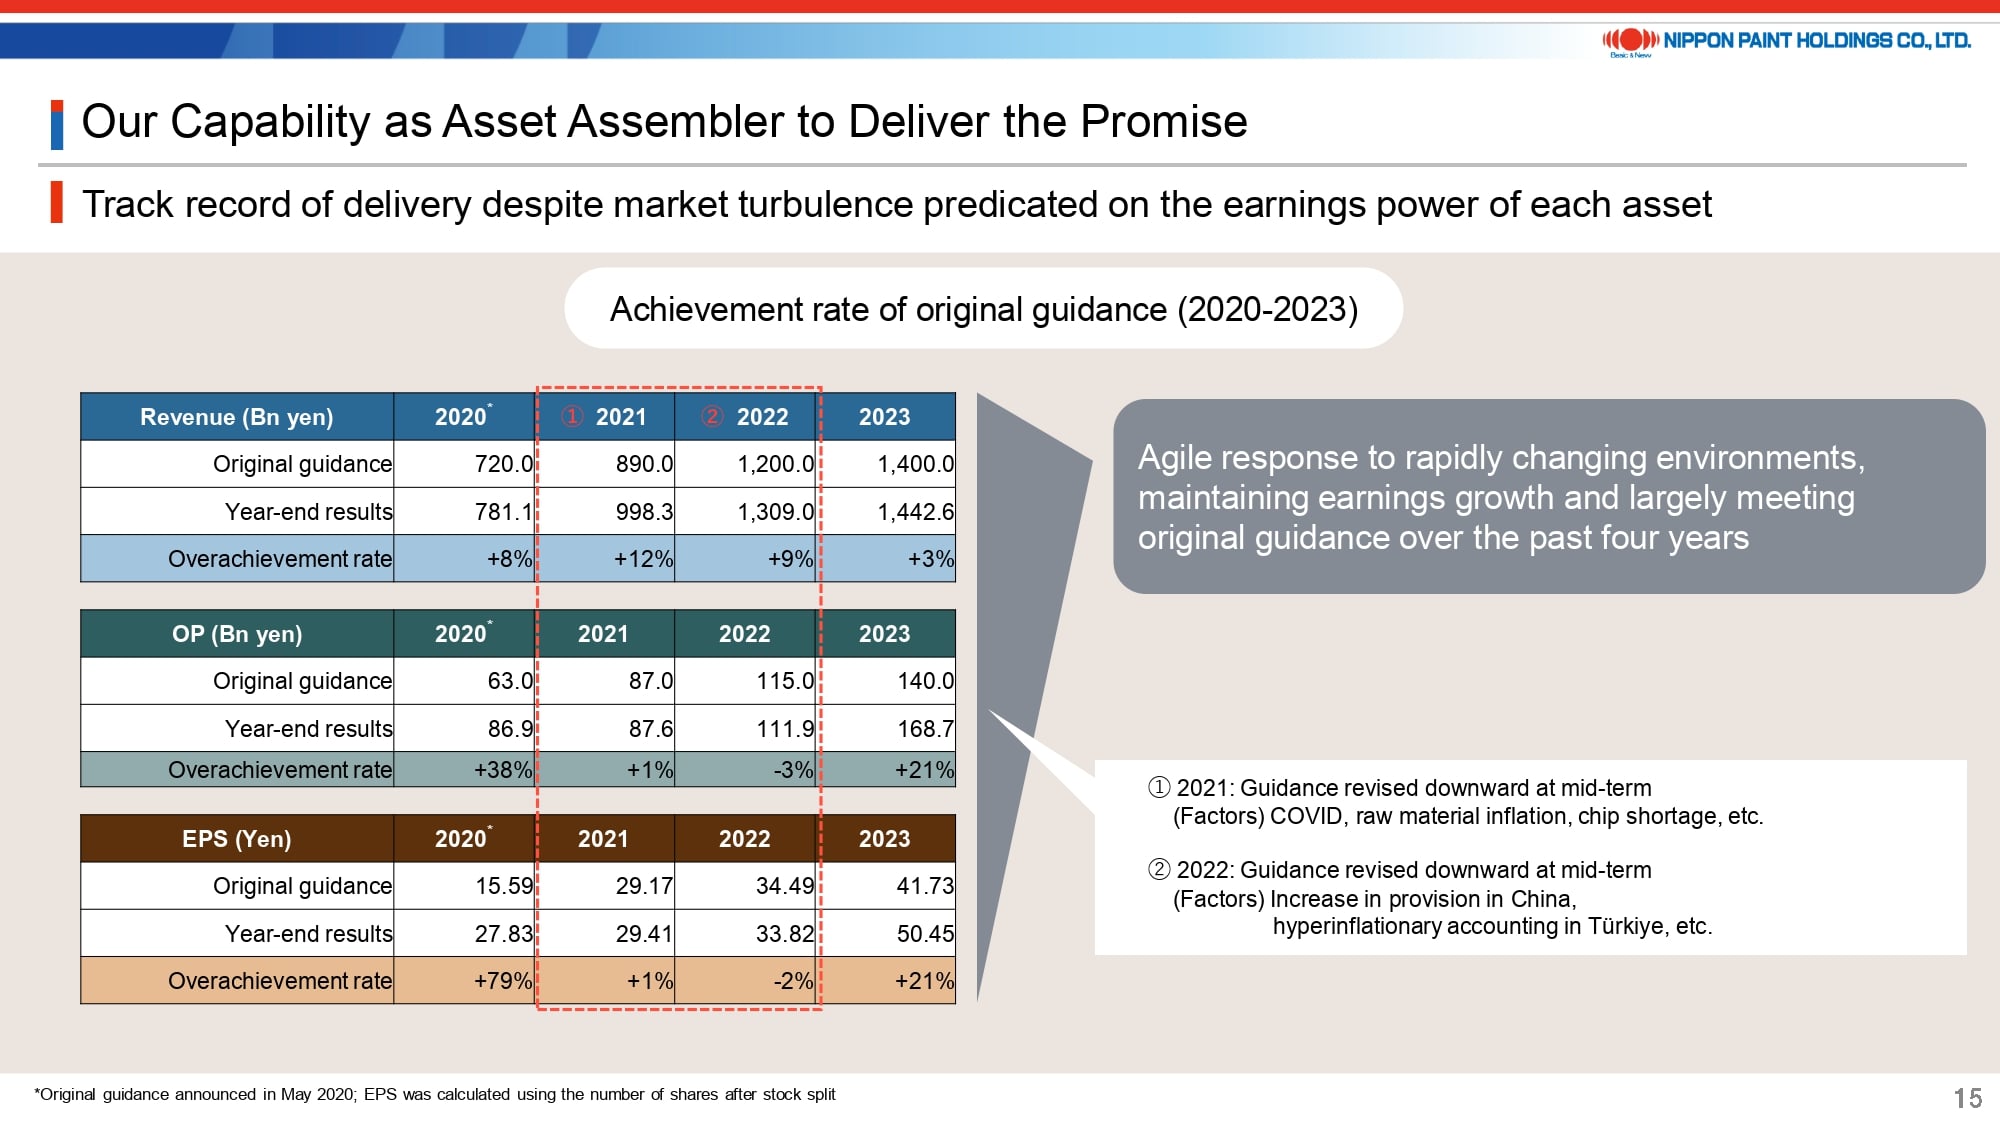
On page 15, I aim to highlight the reliability of our assets by showing how, as a collective, our portfolio has consistently produced results, even amidst various incidents within our diverse range of business portfolios.
In the midst of an exceptionally volatile and challenging business landscape, for example, we found ourselves compelled to lower our initial guidance mid-way through 2021, primarily because of a steep increase in raw material costs, and again in 2022, owing to provisions in China and hyperinflationary accounting practices in Türkiye. Nonetheless, the table presented here demonstrates that we were broadly able to meet our original forecasts. Furthermore, in 2023, a year marked by fewer unexpected events compared to previous years, we consistently exceeded our initial guidance.
12. Our Approach to Maximize PER
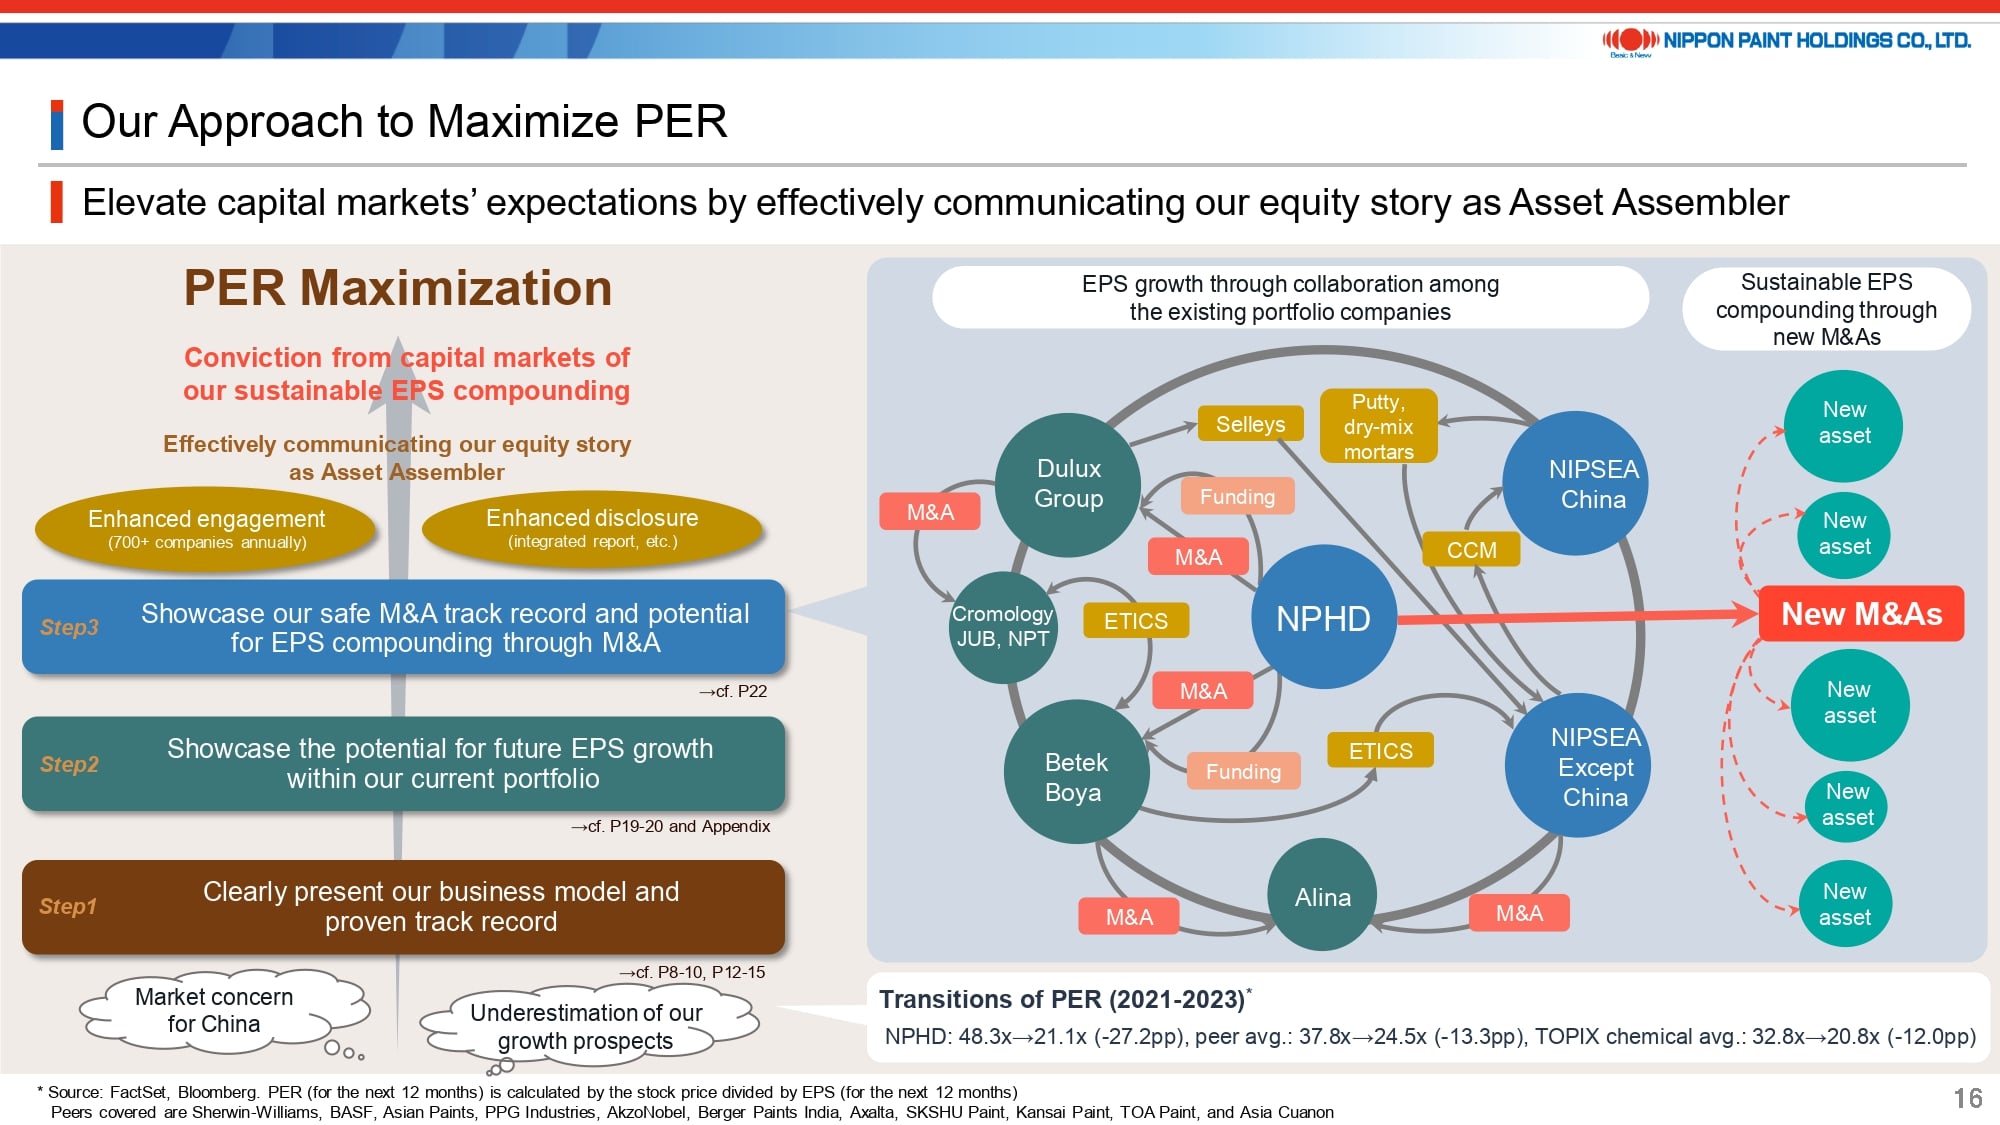
Although our EPS has shown steady growth, it’s evident that our stock price has not experienced the anticipated rise aligned with this growth. We recognize that we are not fully maximizing PER in the present circumstances.
We believe there are multiple reasons for this, but our assessment indicates that market apprehensions about risks in China and an underestimation of our growth potential, including our organic growth, play significant roles.
To strengthen the capital markets’ confidence and maximize PER, we will take the following steps:
- Clearly communicate our strategies, business model, and track records, as explained today, to capital market participants.
- Showcase our growth potential, leveraging our current asset portfolio.
- By clarifying our approach to M&A for investors, we aim to bolster their confidence in our future efforts to compound EPS through M&A activities, which may not align easily with traditional evaluation models.
- Highlight our role as an “EPS Compounder” or, put another way, an “EPS Compounding Machine,” by improving our engagement with investors and the quality of our disclosure materials.
We highly value and eagerly anticipate your feedback and perspectives as investors, and we are grateful for your ongoing involvement.
13. EPS Compounding Supported by the Aligned Co-Presidents, Majority Shareholder and BOD
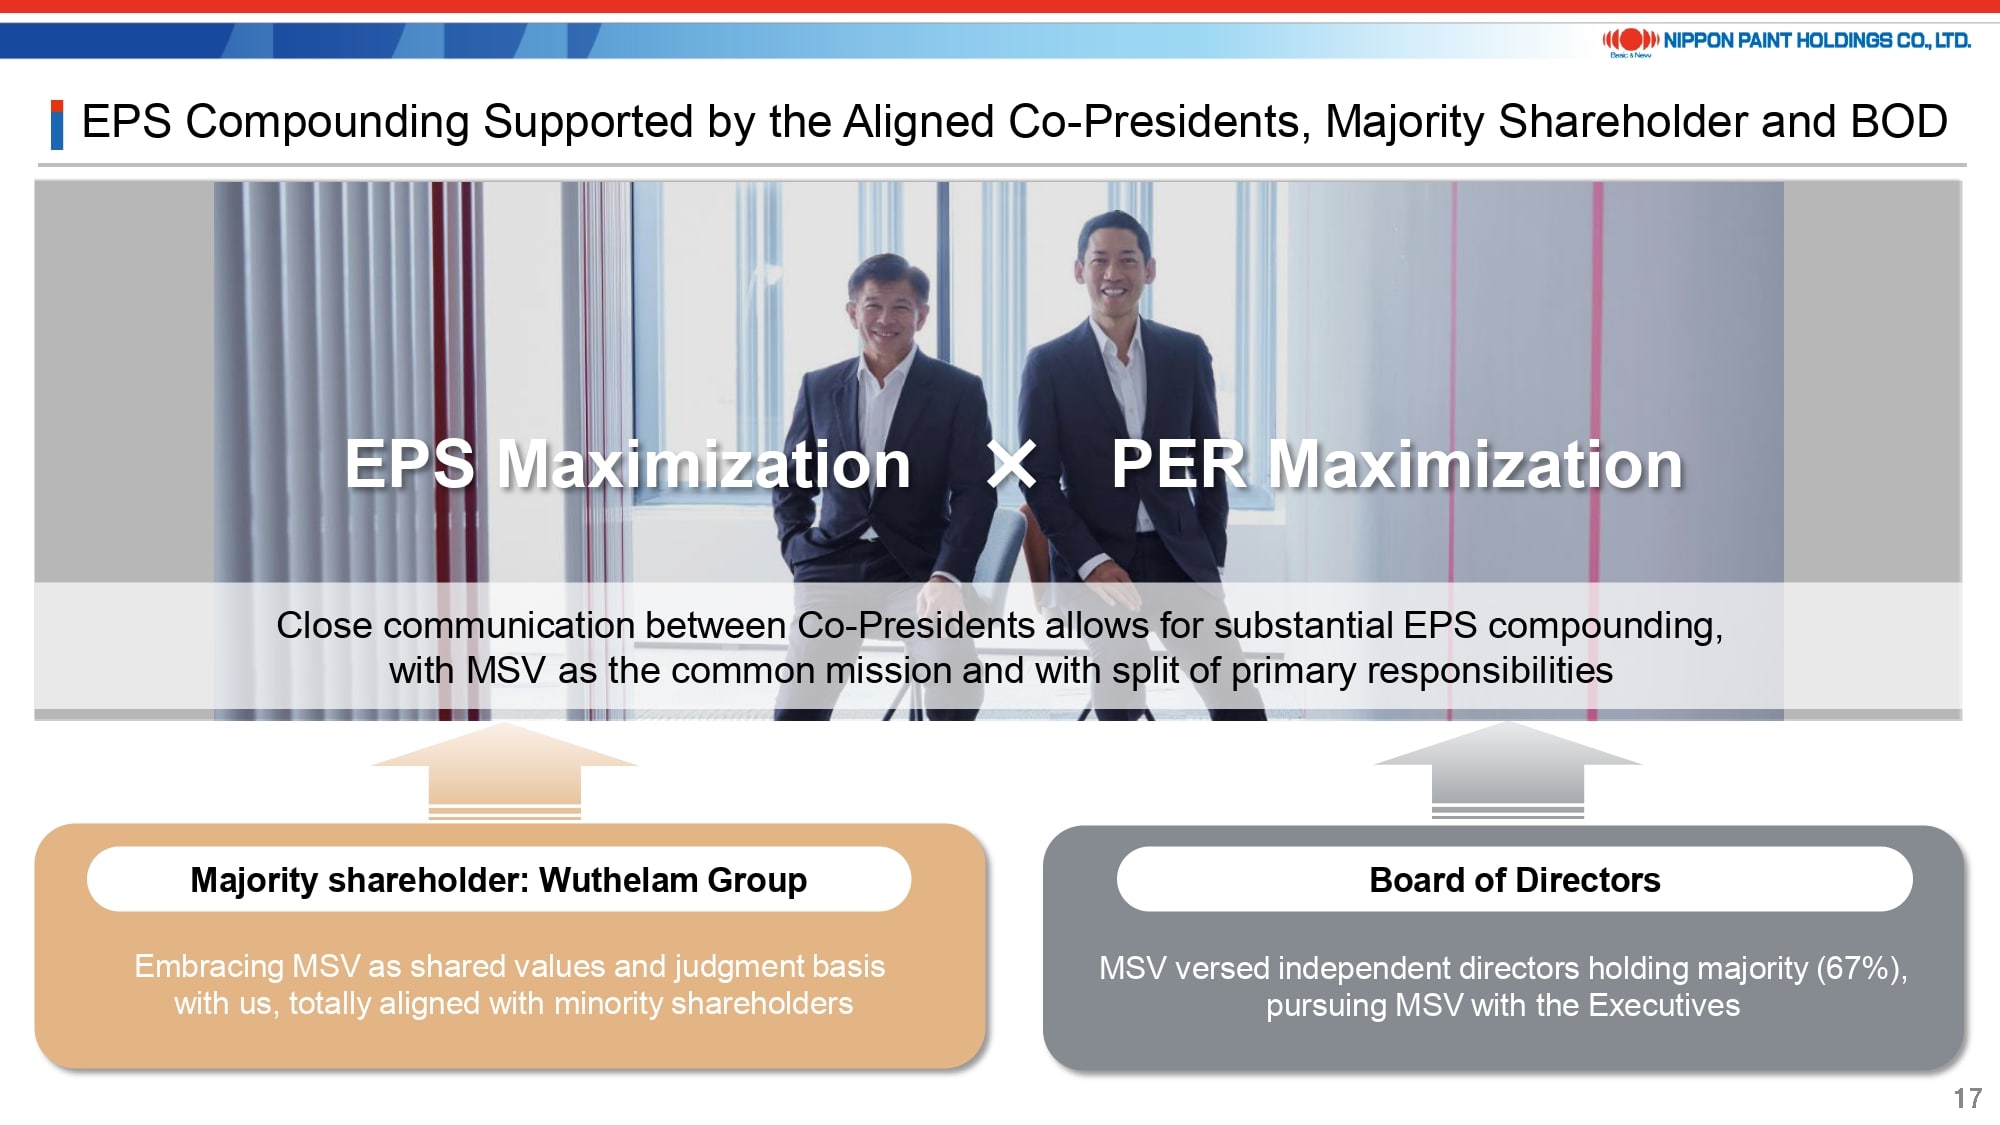
I would also like to elaborate on the structure that underpins the EPS compounding process I just described.
Upon introducing the Co-President setup in April 2021, there were widespread doubts regarding its effectiveness. However, such inquiries have since become infrequent. I am proud to report that we have executed numerous actions swiftly, not merely without delay. This achievement has been facilitated by the tight collaboration between Mr. Wee, with his extensive experience in business operations, and myself, with a specialization in capital markets and M&A. Central to our success is our shared focus on MSV as our sole mission, complemented by our approach of setting aside personal egos.
We have consistently maintained open lines of communication with the majority shareholder, who shares the interests of the minority shareholders, as well as with the Board of Directors, which is predominantly composed of Independent Directors. All three parties are united by MSV as the sole mission across all circumstances, a synergy we identify as one of our key strengths.
14. Organic Growth (1) —Growth Forecast by Asset
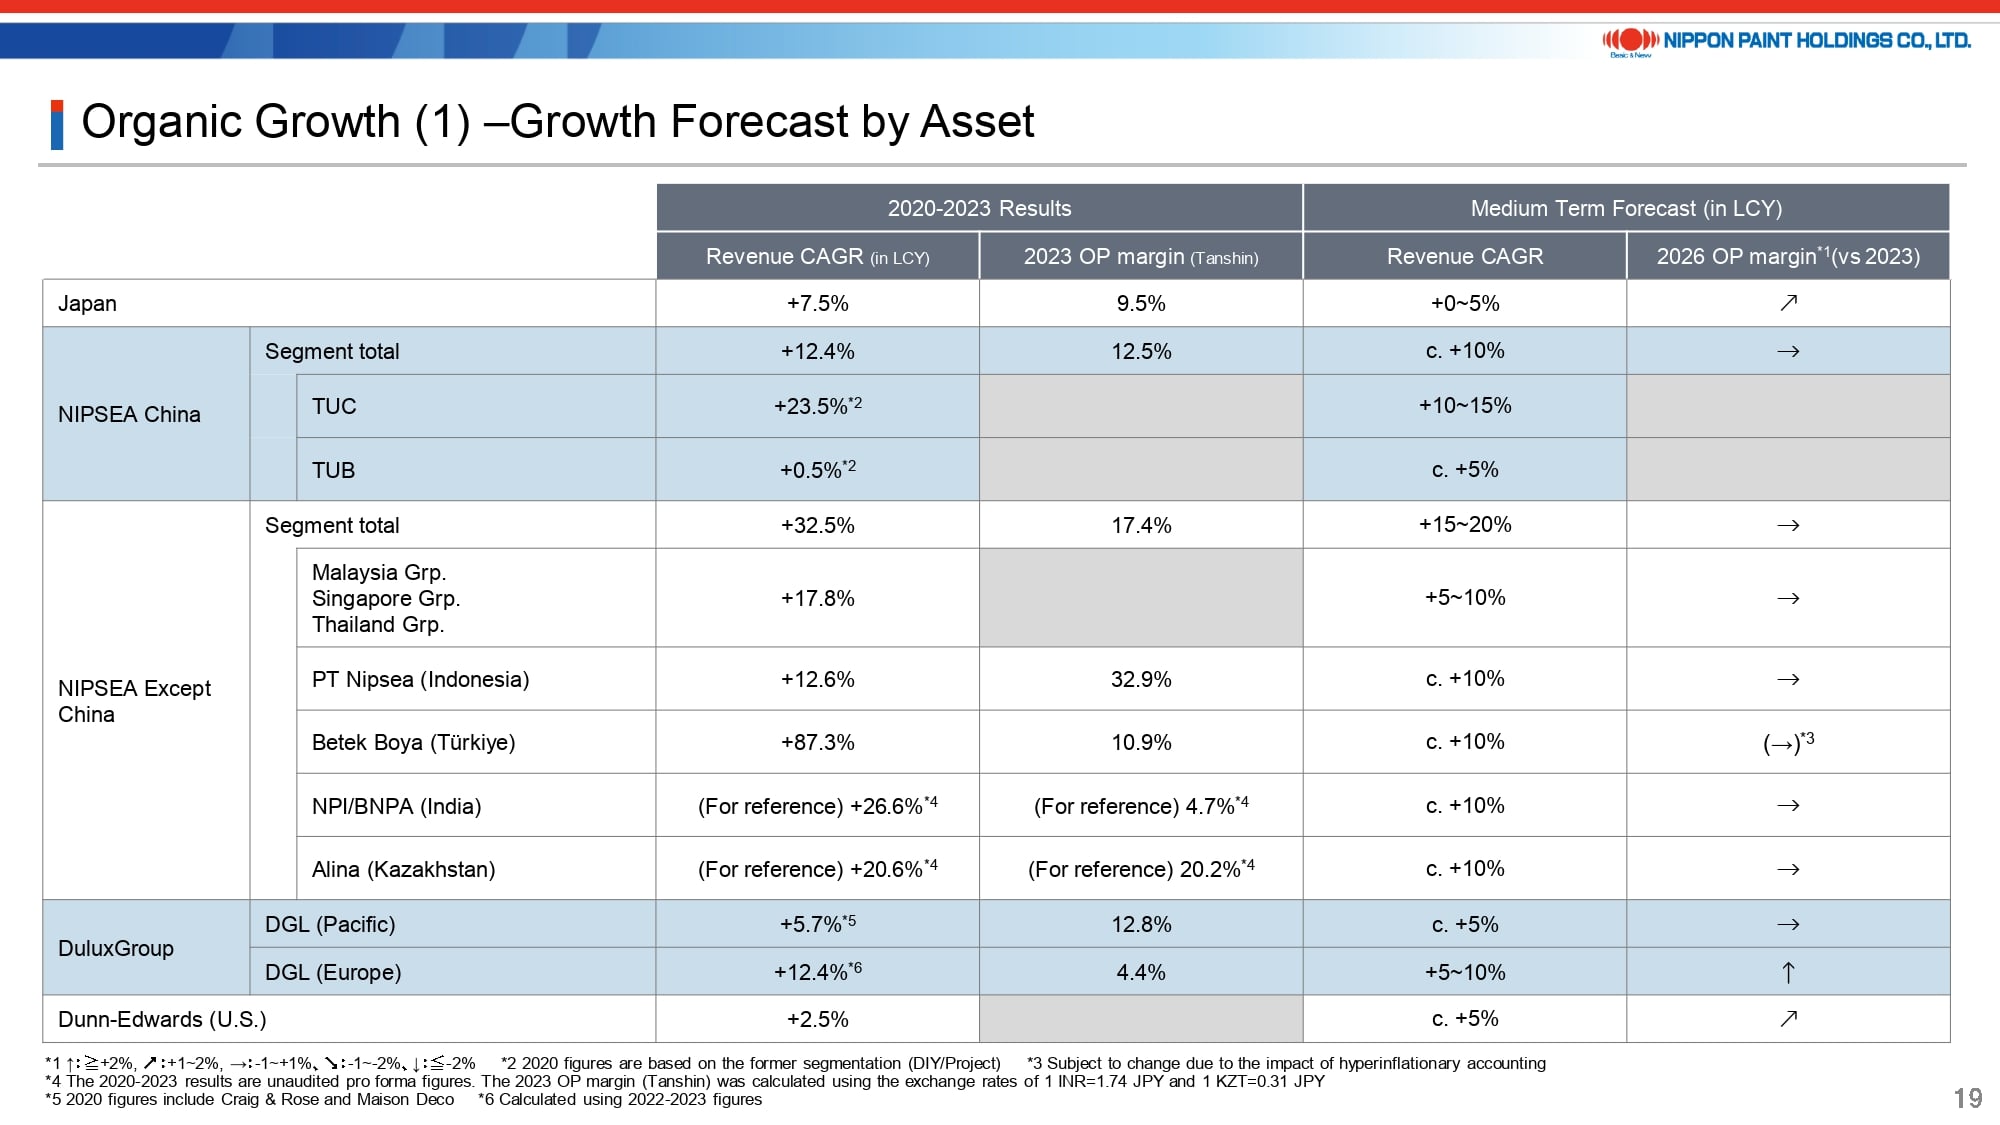
Next, I’ll provide an overview of our organic growth strategy.
Page 19 of the presentation outlines the medium-term growth projections and margin trends for each asset, with no significant deviations from our earlier explanations. Regarding our business in China, which garners considerable interest from investors, we are confident in achieving sustainable growth. This optimism is based on brand-driven market share gains supported by solid demand, primarily from repainting activities.
15. Organic Growth (2) —Strategy by Asset
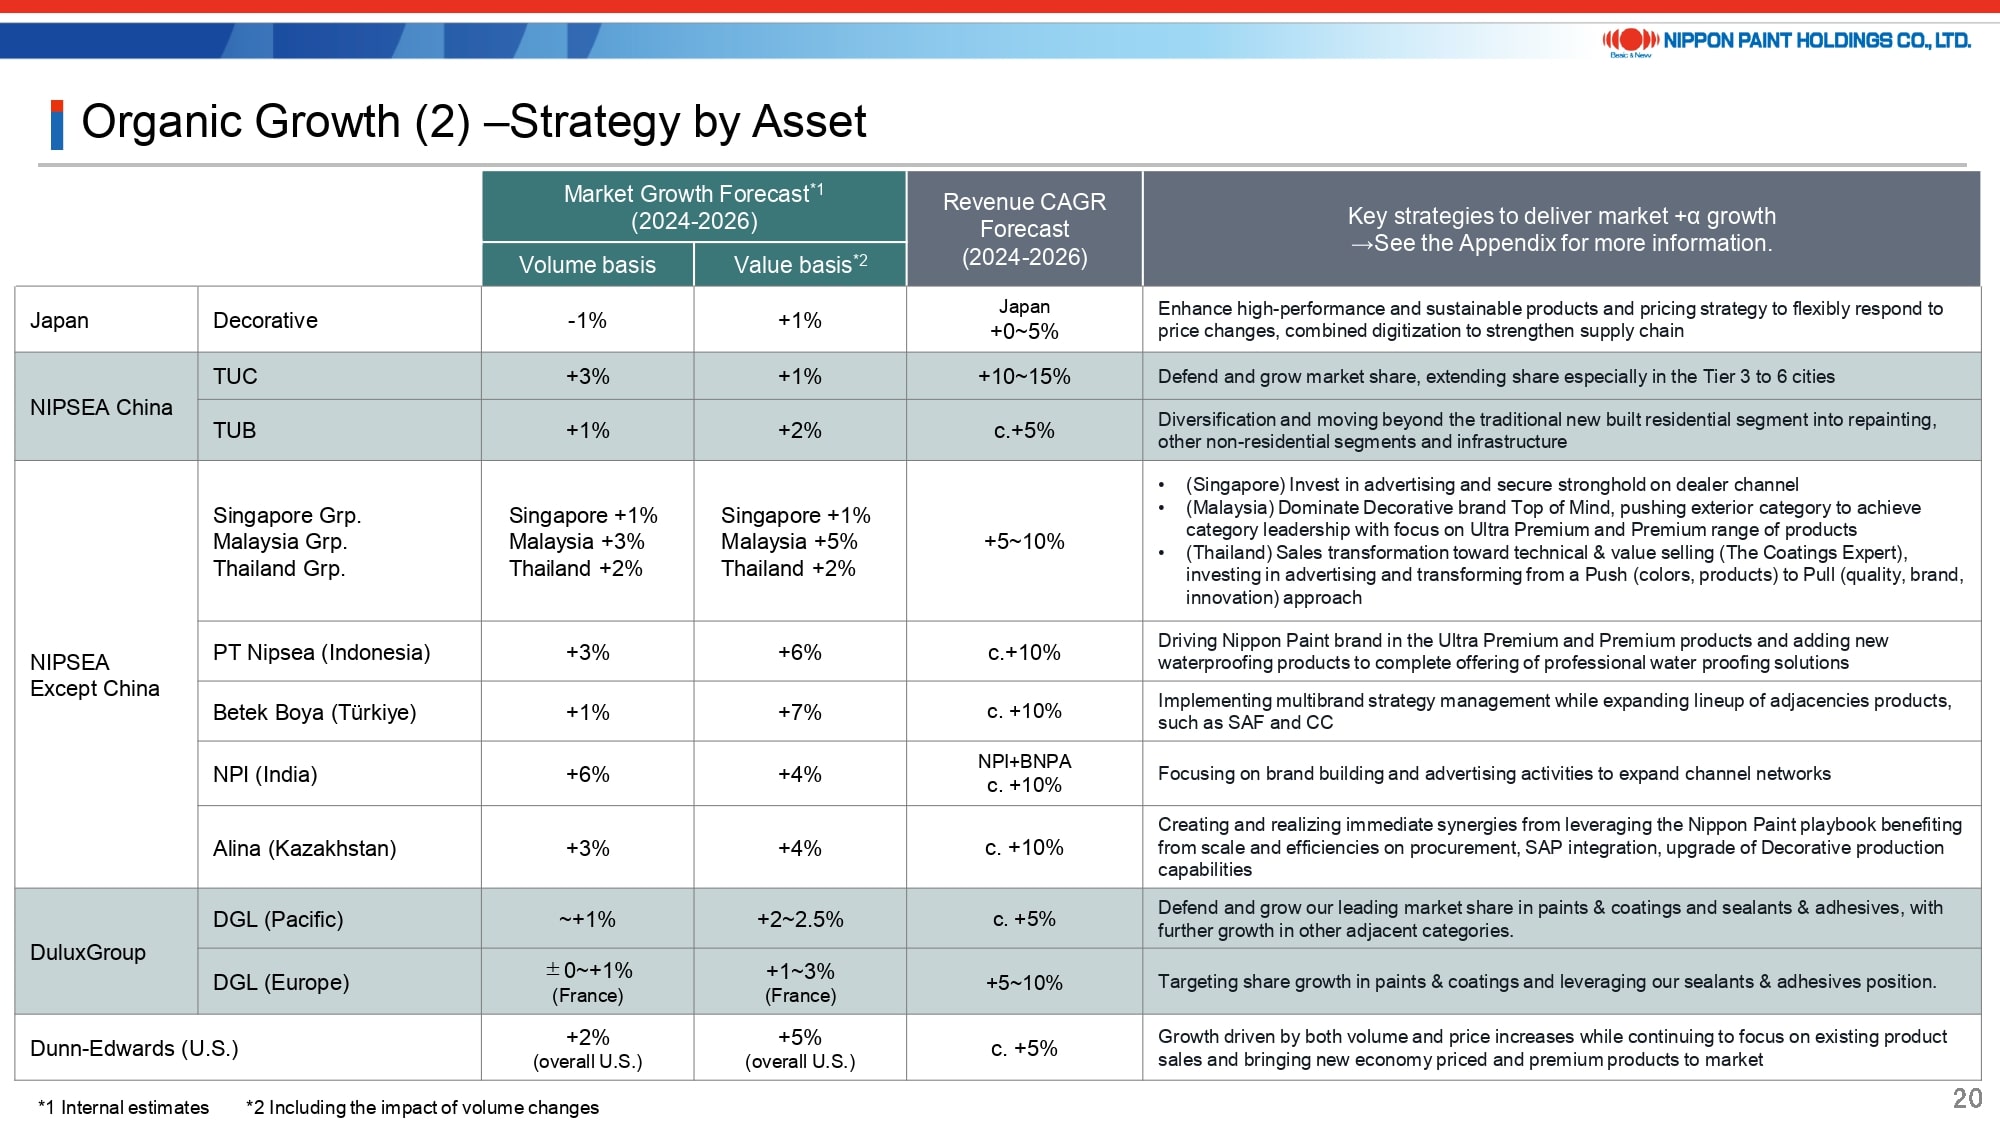
Page 20 showcases our growth predictions for each asset alongside market-specific growth forecasts.
These value basis forecasts account for the effects of sales volume changes. For example, while demand in the China market is robust in terms of volume, growth based on value might not match volume growth due to economic conditions. Consequently, we anticipate a 10-15% growth on a value basis, driven by the expected stronger performance of lower-priced products.
16. Illustration of Inorganic Growth
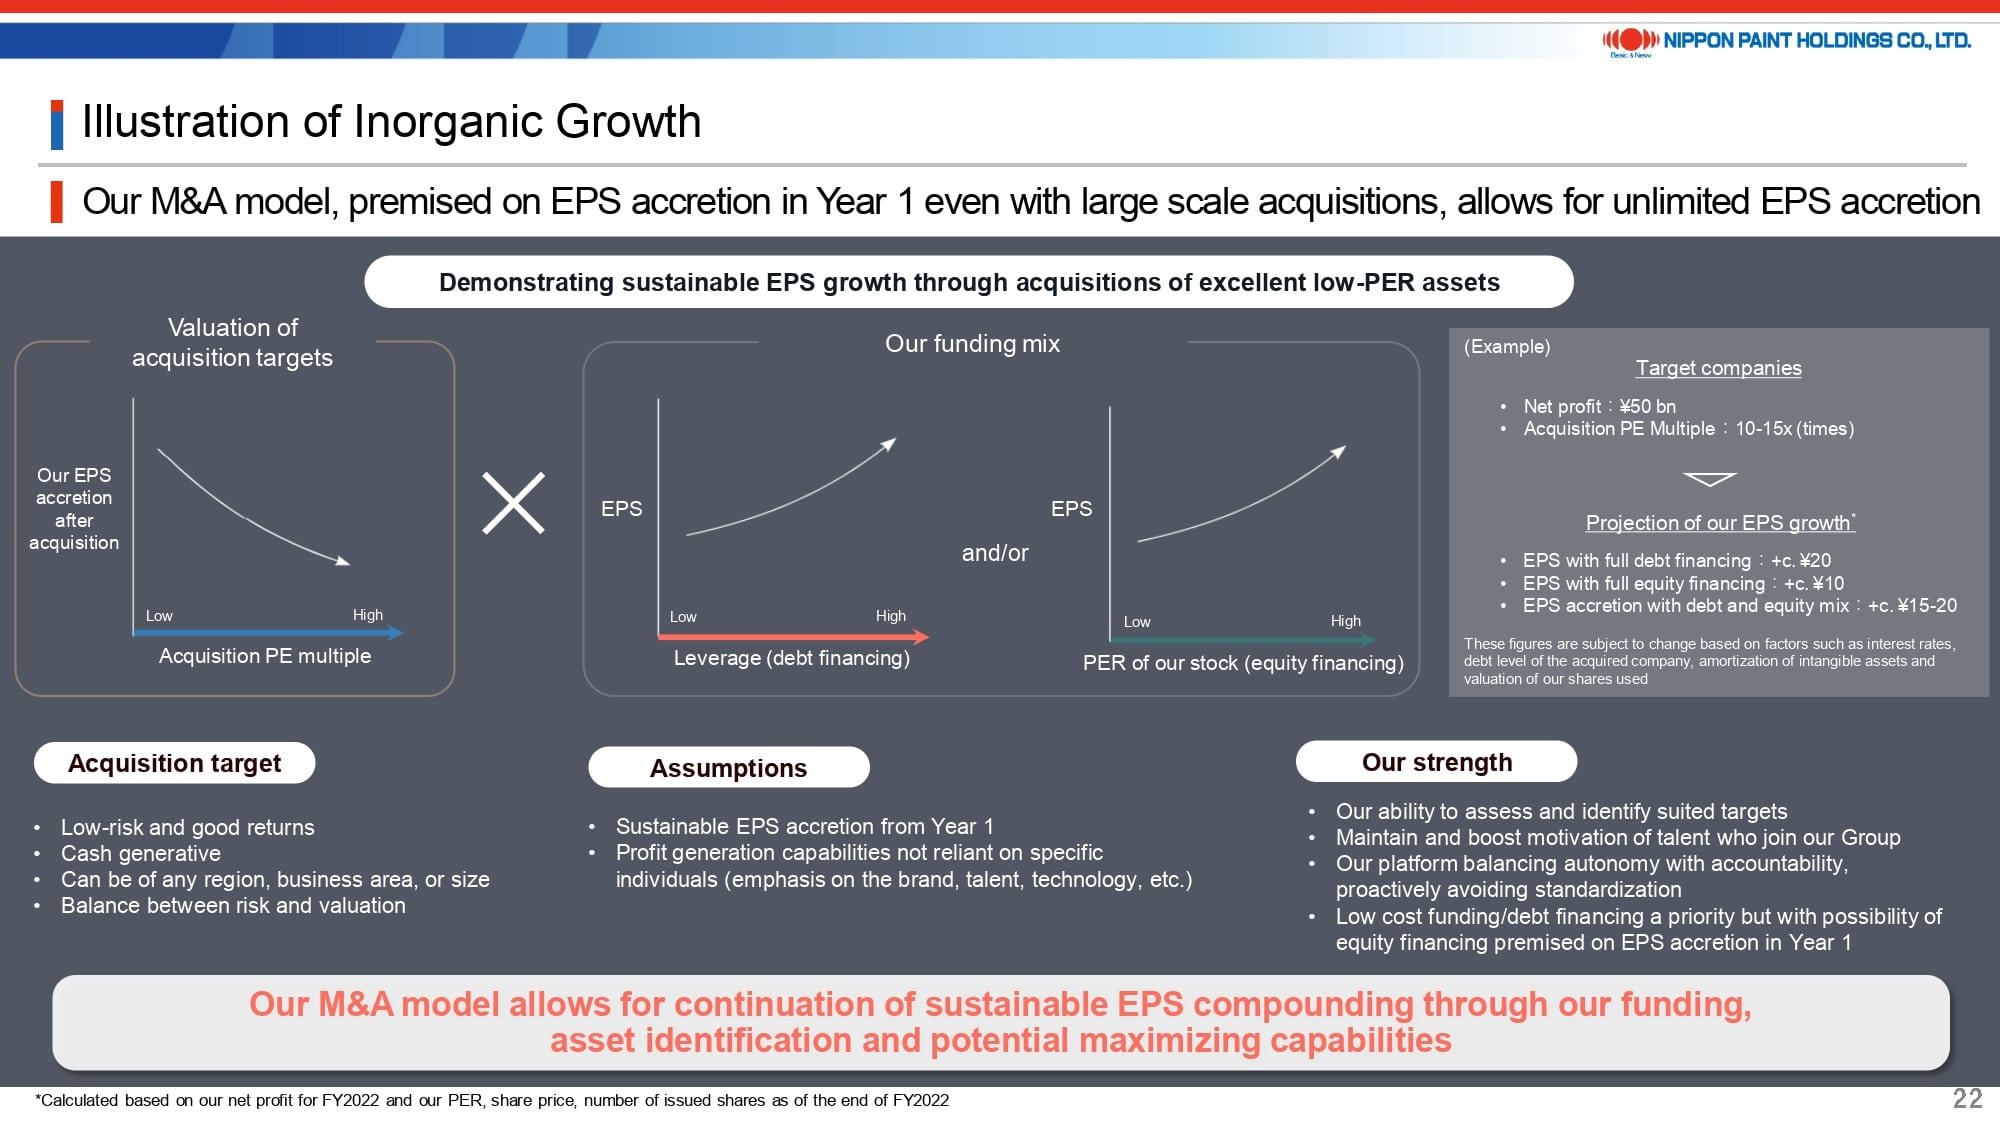
We’re unable to present specific benchmarks for inorganic growth at this time. However, I will outline our strategy for promoting inorganic growth.
Recently, investors have questioned whether our attention is currently on post-merger integration (PMI), leading to a pause in our M&A activities. The simple answer is “No.” After thorough evaluations, we’ve opted not to proceed with several potential deals.
Our Asset Assembler model affords us the unique advantage of pursuing new acquisitions while simultaneously unlocking the potential of each acquired asset, all the while steering clear of standardization. Indeed, we are constantly in the process of evaluating new acquisition opportunities.
The conceptual diagrams found on page 22 of the presentation are from the Integrated Report 2023. While I won’t delve into them extensively here, I will say that we are confident in our ability to significantly compound EPS. This confidence is based on strategic valuations and a diverse funding approach, provided that the acquisition targets are both secure and high-caliber companies.
I have always emphasized that, although we prioritize debt financing, equity financing is still a viable path if it can significantly enhance EPS. However, given the current state of our stock price—or to be more precise, our PER level—the appeal of equity financing has diminished. This shift necessitates a more focused approach to evaluating the valuation of potential acquisition targets than ever before. Yet, as I’ll explain further on, our short-term leverage has decreased, and our robust cash generation ability provides us with substantial funding capacity. Thus, we continue to be dedicated to engaging in M&As that will contribute to MSV.
17. Sustainability Initiatives That Drive EPS and PER (1)
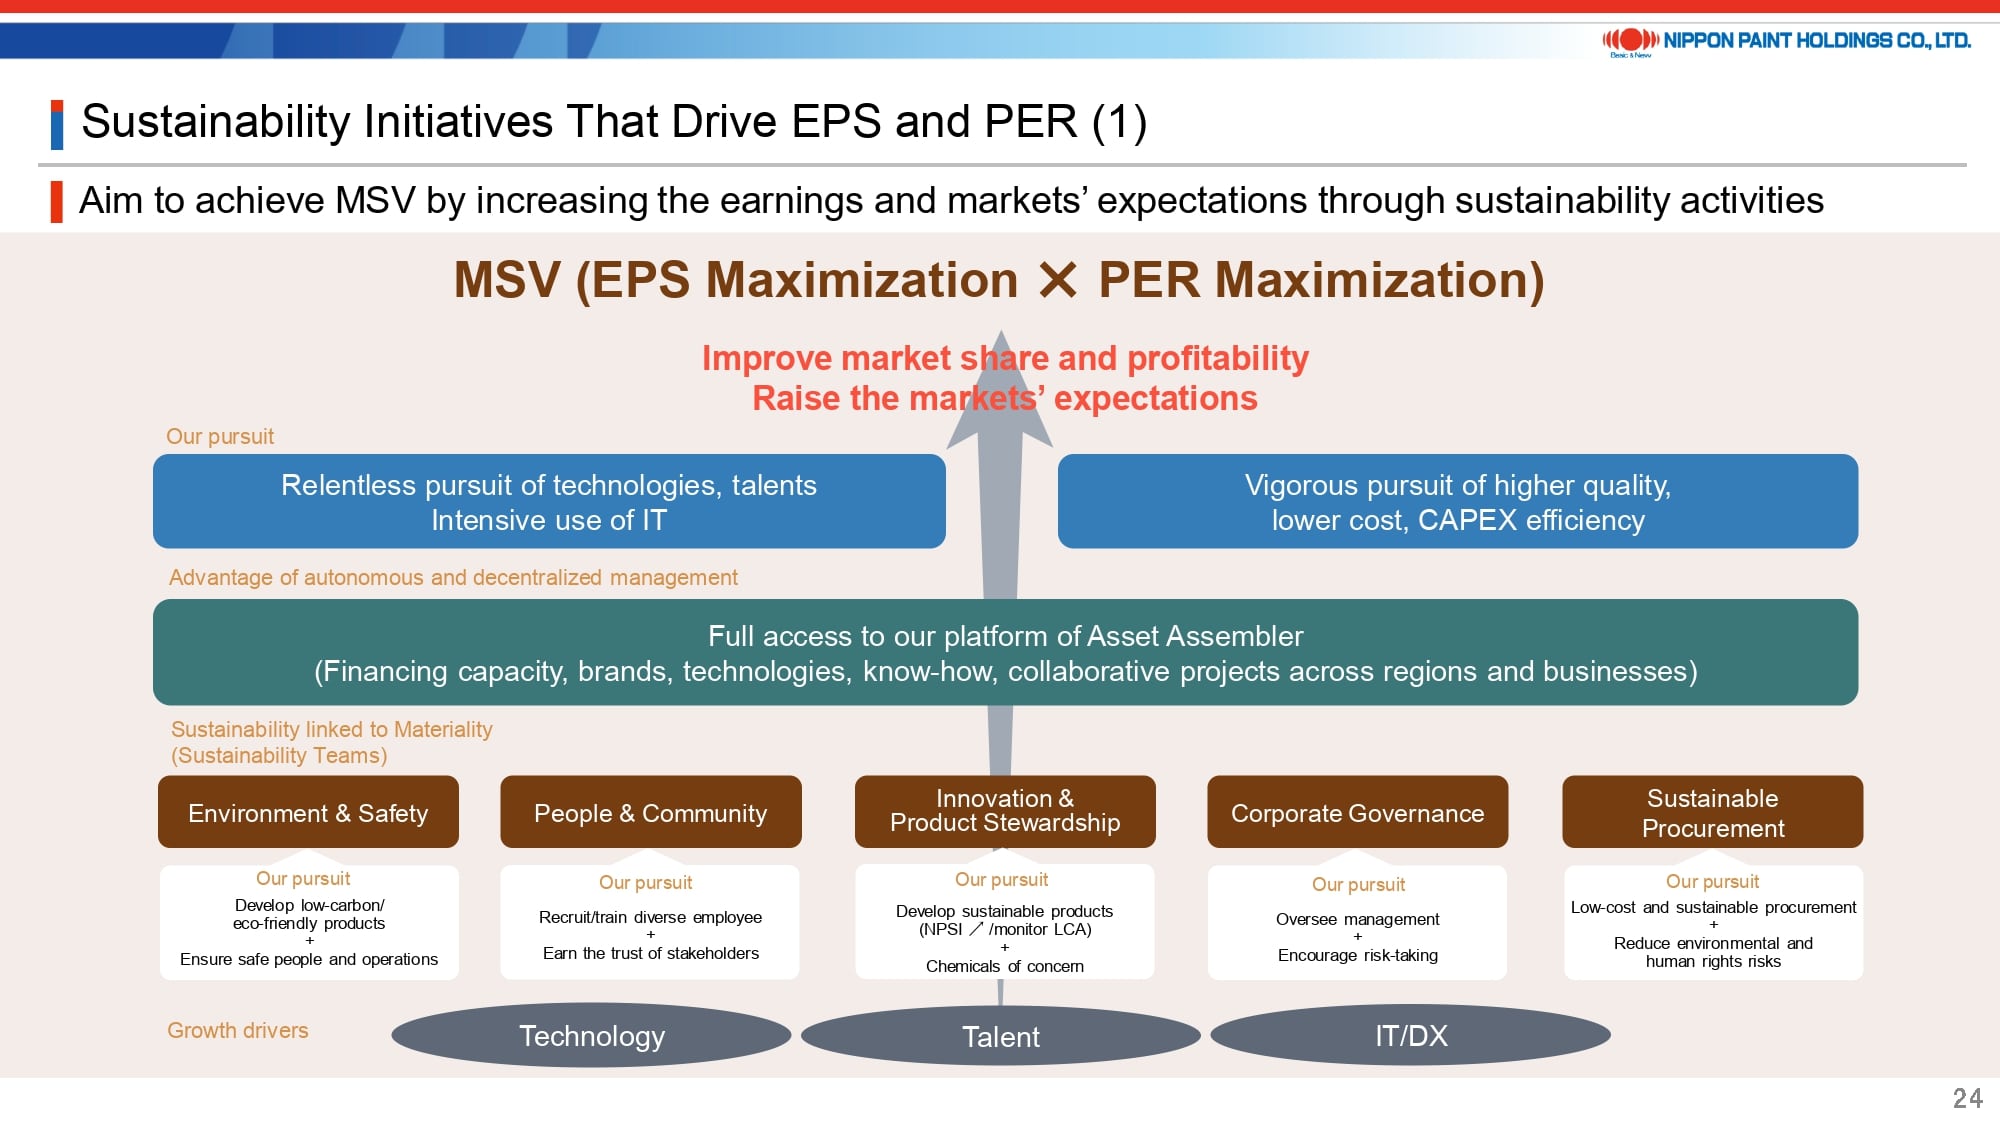
Beginning with page 24, I will outline our strategy for sustainability.
Our sole mission of MSV is premised on the fulfillment of our obligations to stakeholders, encompassing legal, social, and ethical duties. We view sustainability initiatives as integral to MSV, rather than viewing sustainability as an end in itself.
Following this philosophy, the heads of our five sustainability teams have been selected from among the leaders of our partner companies. Utilizing our position as Asset Assembler, we aim to achieve MSV by engaging in cross-organizational efforts that not only develop technologies and nurture talent but also address our environmental and human rights obligations.
18. Sustainability Initiatives That Drive EPS and PER (2)
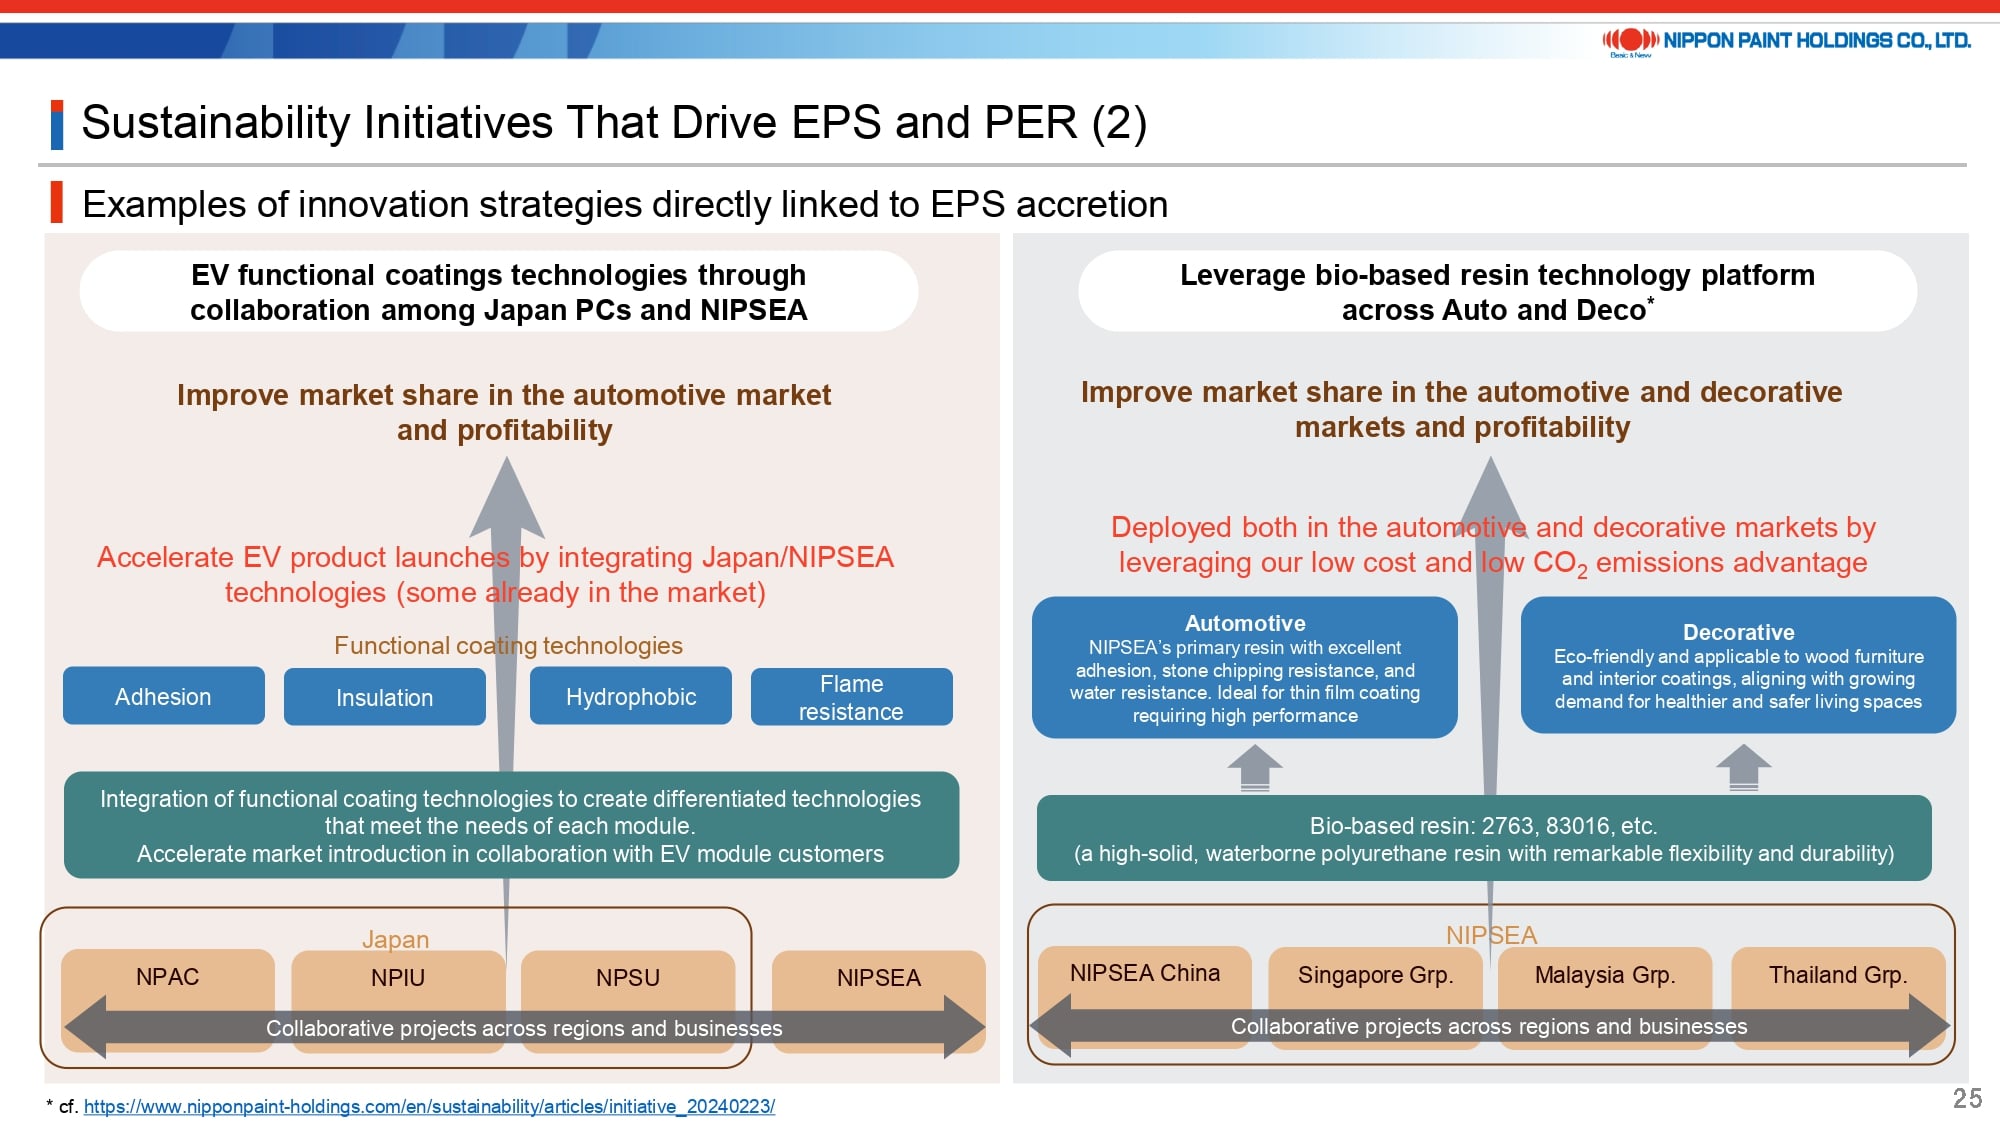
Highlighting our strategy for technological innovation, we are pushing forward with the advancement of EV coating technology and broadening the application of bio-based resins. This is achieved through collaborative efforts in technology development and knowledge sharing across regions. Our goal is to embark on initiatives that not only address societal challenges but also boost our earnings.
19. Sustainability Initiatives That Drive EPS and PER (3)
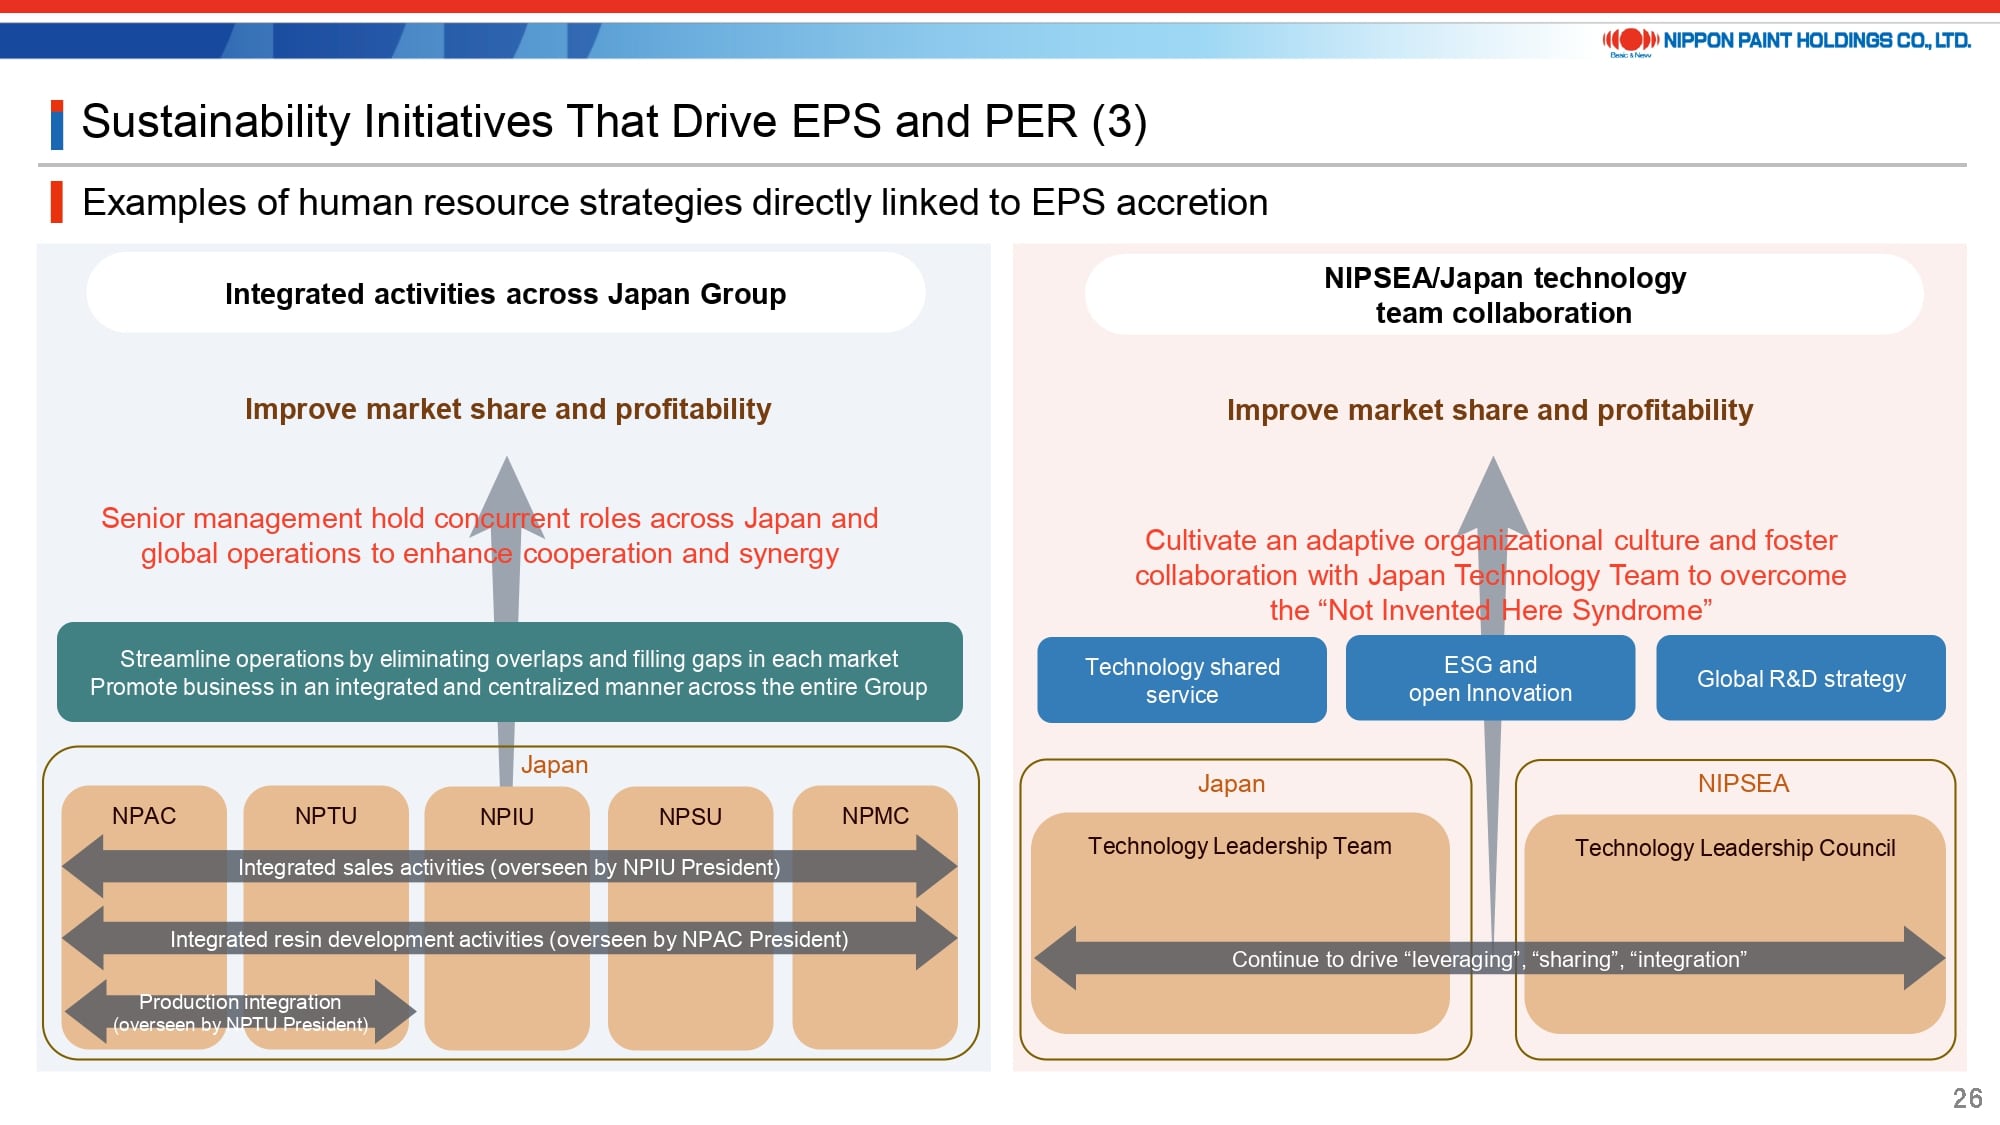
I will also present an example of our strategy for human resource management.
Following the spin-off of our Japan segment, which had a revenue of approximately 200 billion yen in 2015, a process we refer to as “bunshaka,” each of the five partner companies has embraced autonomy. This shift has led to enhanced accountability within each business unit. Conversely, this approach has led to challenges, including inflexibility in human resource allocation and the emergence of silos within organizations. Instead of incurring additional costs to reintegrate these partner companies, our strategy involves appointing leaders to concurrent positions to facilitate overall optimization. Within the Japan Group, for example, we have already appointed a CTO to oversee technology teams. Beyond this, we are gradually integrating operations across sales, resin development, and production.
20. Finance Policy to Accelerate EPS Compounding (1)
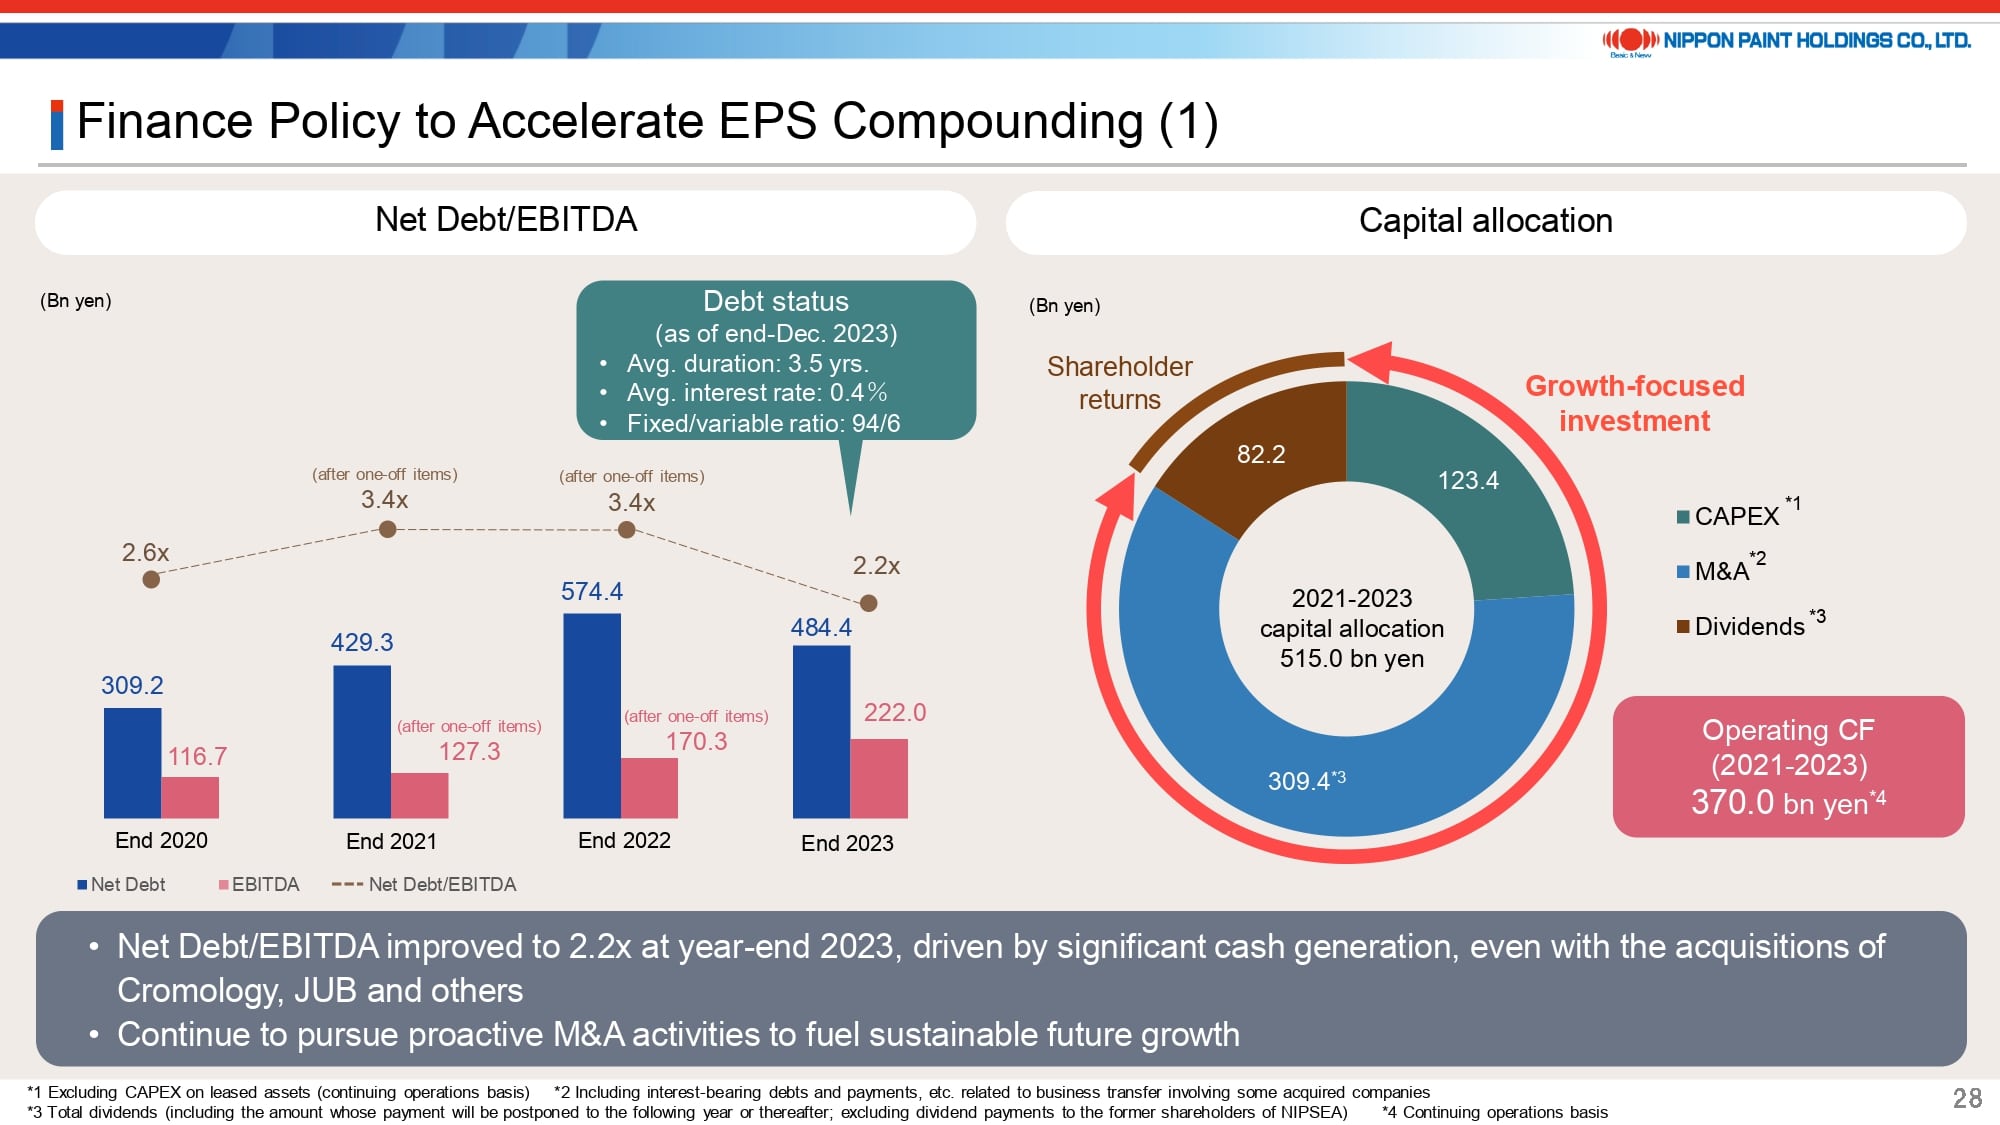
Next, I’ll outline our financial position.
As discussed earlier, our Net Debt/EBITDA ratio at the end of 2023 decreased to 2.2 times, thanks to a substantial boost in cash flows. This improvement was driven by increased earnings and an enhanced CCC in 2023. Over the last three years, we’ve generated cash flows of roughly 370 billion yen, with 120 billion yen allocated to CAPEX, 80 billion yen towards dividend payments, and over 300 billion yen directed into M&A activities. Consequently, while net debt has risen due to financing activities, EBITDA has also increased. Considering the characteristics of our operations, our financial standing remains robust and secure.
21. Finance Policy to Accelerate EPS Compounding (2)
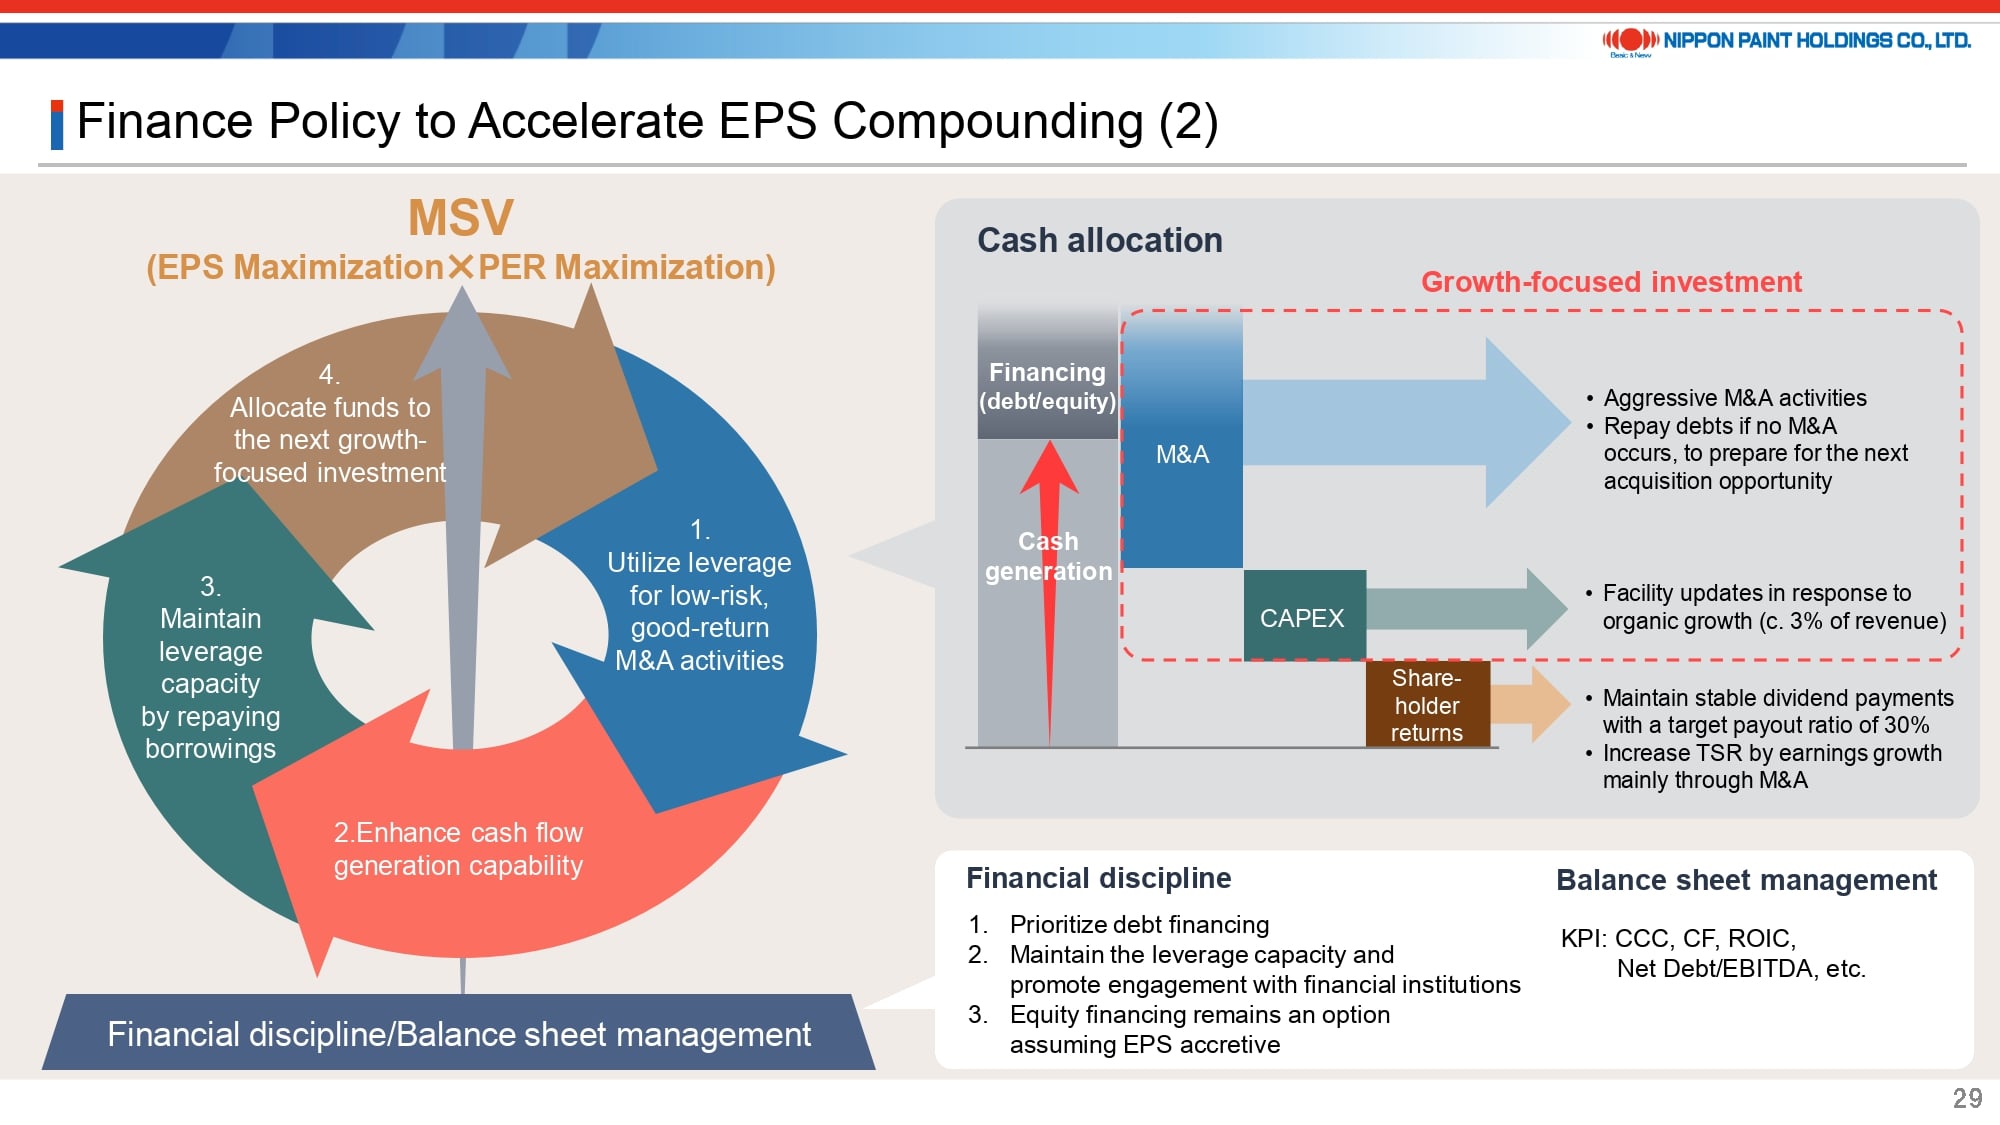
Our financial strategy moving forward remains largely unchanged.
We place great emphasis on our ability to compound sustainable EPS. Accordingly, we will direct cash generated towards M&A activities to ensure future growth, thereby delivering value to our shareholders.
Occasionally, I’m asked whether we plan to conduct a share buyback. While it’s accurate that we aren’t content with our current stock price, the question boils down to whether to allocate our valuable capital towards purchasing our shares at a PER of 21-22 times or towards pursuing acquisitions of companies with lower valuations or M&As with promising growth prospects. Considering our focus on sustainable EPS compounding, share buybacks are not currently among the options under consideration. Nevertheless, we remain open to all possibilities for the future, continuously evaluating market trends.
While we maintain detailed KPIs at each asset level, our approach as Asset Assembler dictates that we refrain from setting uniform margin and CCC targets that disregard the individual circumstances of local operations. The management teams of our partner companies are steadfast in their commitment to improving operations while ensuring sustained growth. We strongly believe that the combined strength of our Group, forged through the collaboration of these partners, transcends the pursuit of standardized indicators.
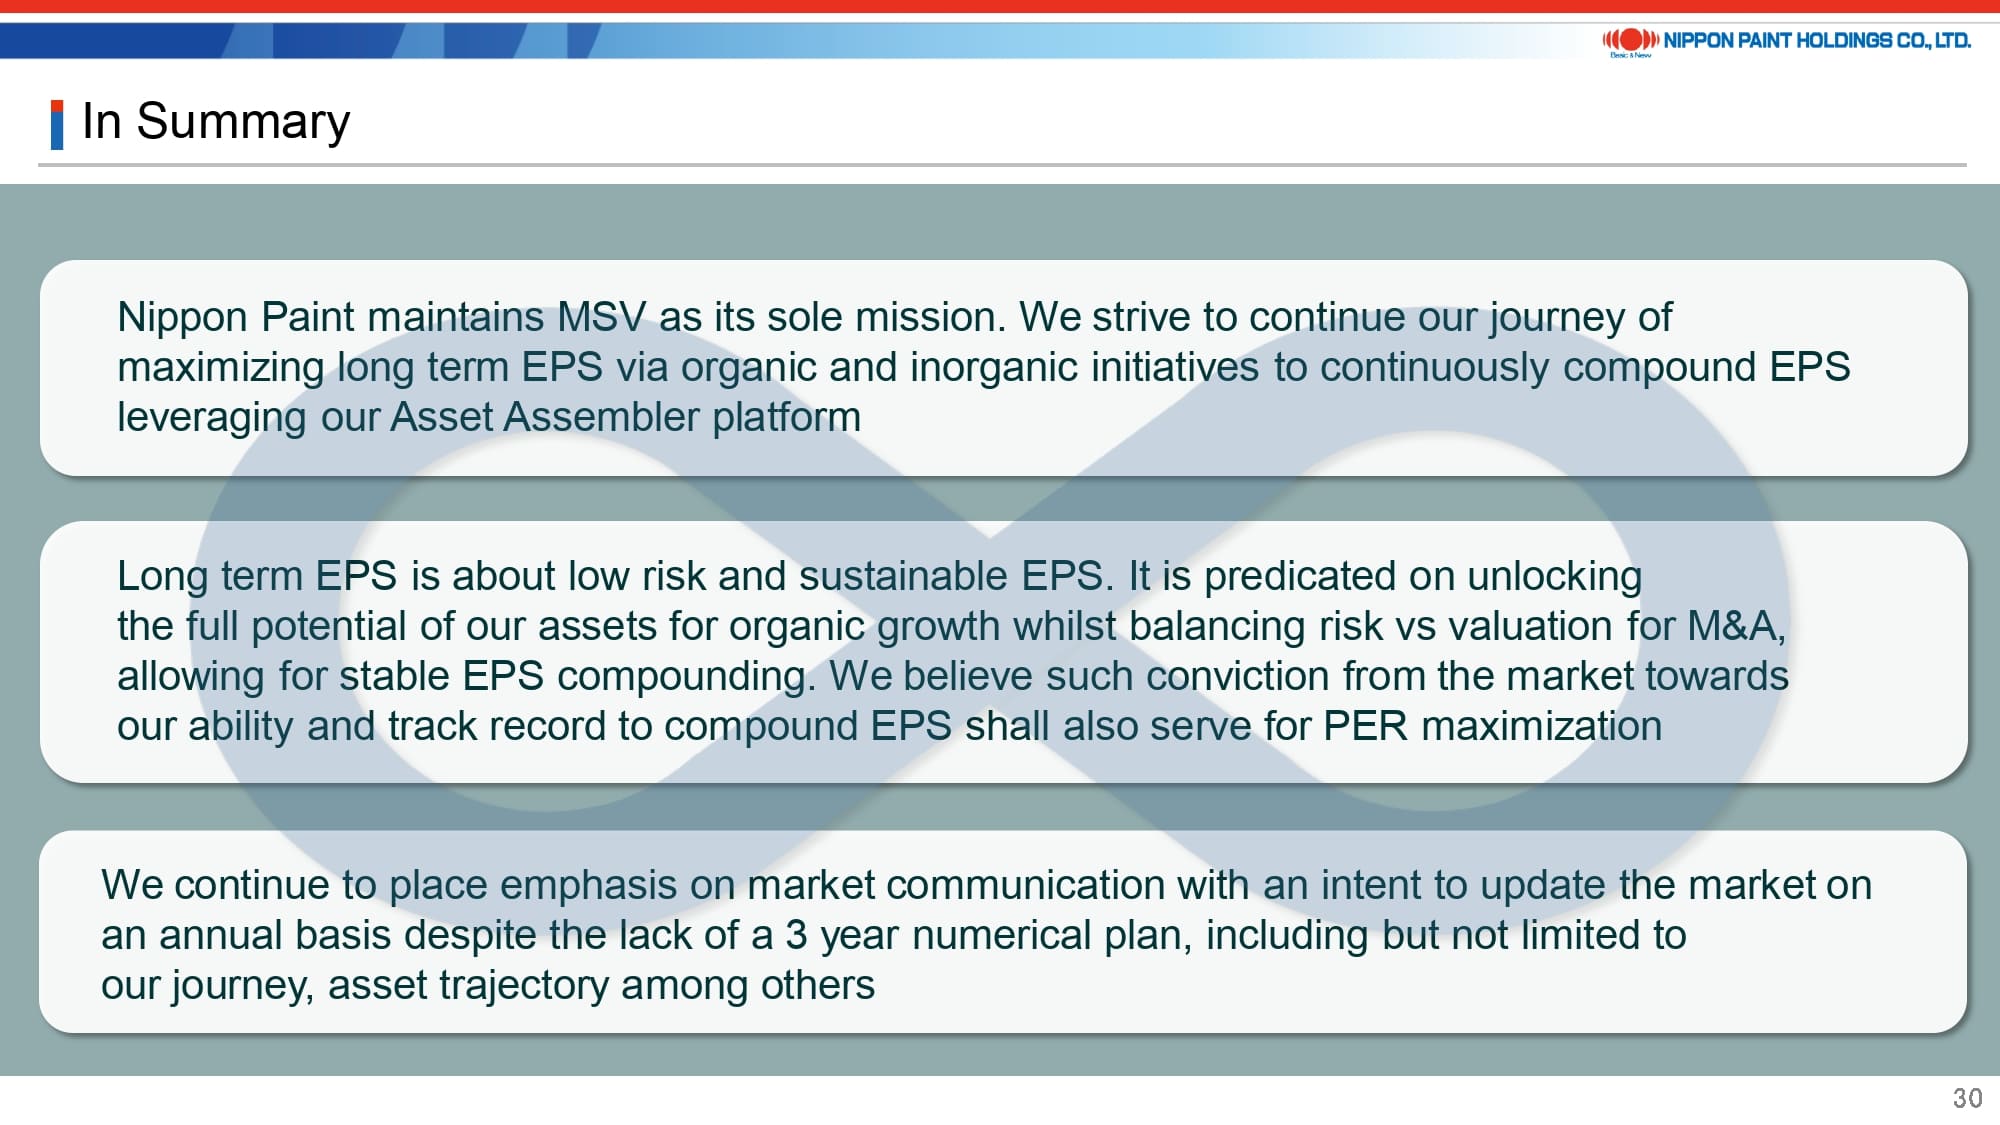
22. In Summary
Allow me to conclude my presentation.
As mentioned earlier, our Group remains steadfast in our commitment to MSV as our sole mission. We are dedicated to maximizing EPS not only in the short term but also in the long term, capitalizing on the advantages of our platform as Asset Assembler.
We aim to drive organic growth by optimizing the potential of each asset and meticulously evaluating the risk-to-valuation balance in M&As. With both strategies enhancing EPS compounding, our focus is on maximizing PER, leveraging our track record and appropriately setting expectations for our future.
In today’s presentation, I aimed to elucidate the rationale behind our decision not to present a conventional 3-5 year medium-term plan, as is customary among Japanese companies. In doing so, I hope to convey that the potential of our Group transcends traditional frameworks. Nonetheless, we recognize the significance of maintaining communication with the capital markets. We will continue to engage with investors and conduct individual investor meetings simultaneously. We appreciate the continued support and guidance from our investors.
Thank you all for your attention today.