Latest Results
Consolidated Financial Results for the Three Months Ended March 31, 2025 (January 1, 2025 to March 31, 2025)
For the three months ended March 31, 2025, Nippon Paint Group’s consolidated revenue increased by 5.6% compared to the same period last year, reaching ¥405,724 million. This growth was primarily driven by contributions from the consolidation of LSF11 A5 TopCo LLC, which includes AOC LLC—a global specialty formulator—and other affiliated companies, following the completion of its acquisition in March 2025. Consolidated operating profit increased by 24.7% to ¥51,432 million, while profit before tax rose by 20.7% to ¥48,193 million. Additionally, profit attributable to owners of parent increased by 25.7% to ¥36,998 million.
*DuluxGroup Limited is an Australian company that holds the rights to the Dulux® trademark exclusively in Australia, New Zealand, Papua New Guinea, Samoa and Fiji. DuluxGroup Limited is not affiliated with, nor connected to, the owners of the Dulux® trademark in other regions and does not sell Dulux® products outside these designated markets.
* As a specialty formulator, the company is engaged in the formulation development, manufacturing, and distribution of unsaturated polyester (UP), vinyl ester (VE), and other solutions for CASE (Coatings, Adhesives, Sealants, and Elastomers), colorants, and composites. These products are used in construction, infrastructure, transportation, marine and other applications.
*“AOC” has been added as a new reportable segment starting from the FY2025 first quarter of the period under review.
Japan
Revenue from automotive coatings increased from the same period of the previous year, driven by a rebound in automobile production following last year’s decline. Industrial coatings revenue increased, as the impact of price adjustments more than counterbalanced weaker market conditions. Revenue from decorative paints remained roughly unchanged from the previous year, with the decline in renovation projects caused by inflation was counterbalanced by initiatives aimed at increasing sales volumes.
Consequently, consolidated revenue rose by 4.1% from the previous year to ¥48,368 million. Consolidated operating profit increased by 19.2% to ¥4,421 million, benefitting from higher revenue and an improvement in the ratio of SG&A expenses.
NIPSEA
Despite a decrease in automobile manufacturing in Thailand, automotive coatings revenue within NIPSEA Group increased due to higher automobile production in China. Additionally, revenue from decorative paints remained flat, as higher sales volumes in our key markets including Malaysia, Singapore, and Indonesia offset the impact of political uncertainty in Türkiye and the absence of sales boost from sales promotion campaigns conducted in the fourth quarter of the previous year.
As a result, consolidated revenue increased by 2.6% from the previous year to ¥221,878 million, and consolidated operating profit grew by 15.9% to ¥34,770 million.
DuluxGroup
Revenue from decorative paints decreased, despite a slight market share gain and acceptance of price adjustments in the Pacific segment, due to the impact of soft market conditions in the Europe segment centered on France. Revenue from the adjacencies business declined due to the soft home improvement market conditions in the Pacific segment and the impact of weak demand for External Thermal Insulation Composite Systems (ETICS) in the Europe segment.
Consequently, consolidated revenue declined by 3.5% over the previous year to ¥89,815 million, while consolidated operating profit increased by 1.6% to ¥7,297 million, mainly attributed to a decrease in SG&A expenses.
Americas
Revenue from automotive coatings decreased compared to the previous year, due to a decrease in automobile production. Revenue from decorative paints increased from the previous year, due to the acceptance of price adjustments and strong sales in Northern California. As a result, consolidated revenue increased by 1.4% from the previous year to ¥28,912 million, while consolidated operating profit fell by 10.3% to ¥1,072 million due primarily to an increase in investments in the decorative paints business in Northern California.
AOC
Income and expenses of AOC, beginning from March 2025, are included in our Group’s consolidated performance. In the adjacencies business, demand in the market was lower compared to the same period of the previous year due primarily to weaker macroeconomic conditions. Consequently, consolidated revenue stood at ¥16,750 million while consolidated operating profit was ¥5,958 million.
Revenue composition
- Revenue composition by region
-
(Million yen)
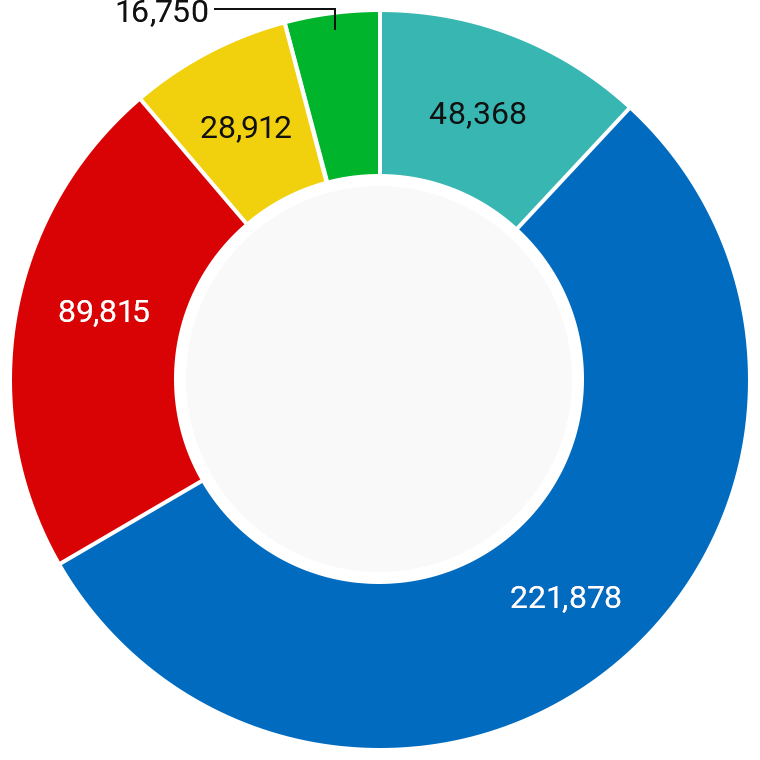
- ■Japan: 48,368
- ■NIPSEA: 221,878
- ■DuluxGroup: 89,815
- ■Americas: 28,912
- ■AOC*: 16,750
*One-month earning; excluding PPA because it is not yet finalized
- Revenue composition by business
-
(Million yen)
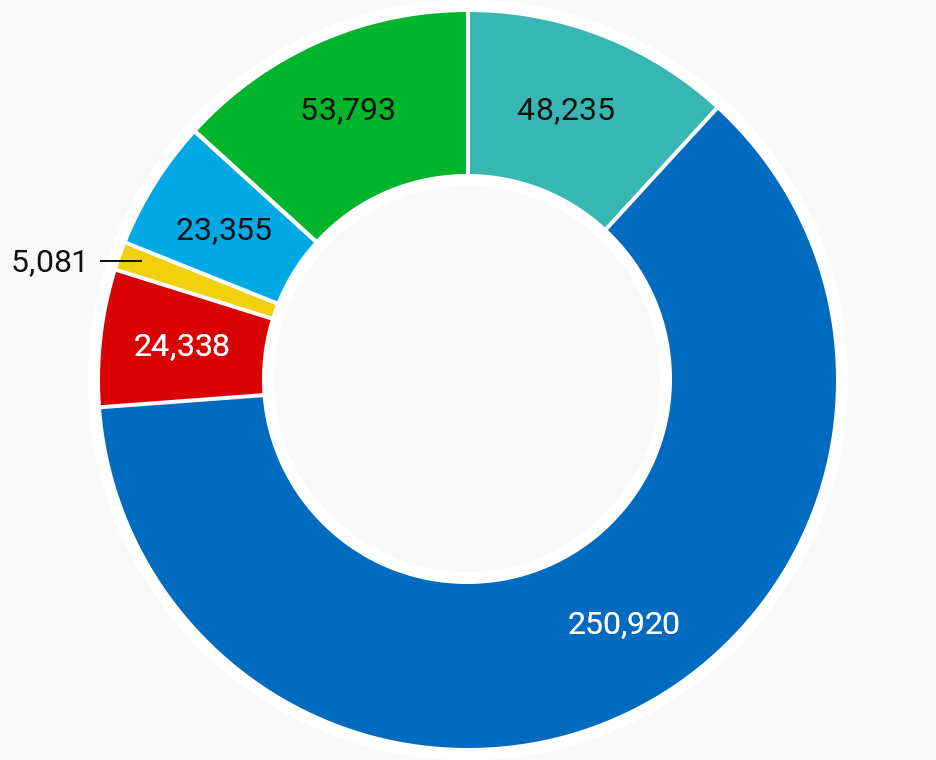
- ■Automotive coatings: 48,235
- ■Decorative paints: 250,920
- ■Industrial coatings: 24,338
- ■Fine chemicals: 5,081
- ■Other paints: 23,355
- ■Adjacencies business: 53,793
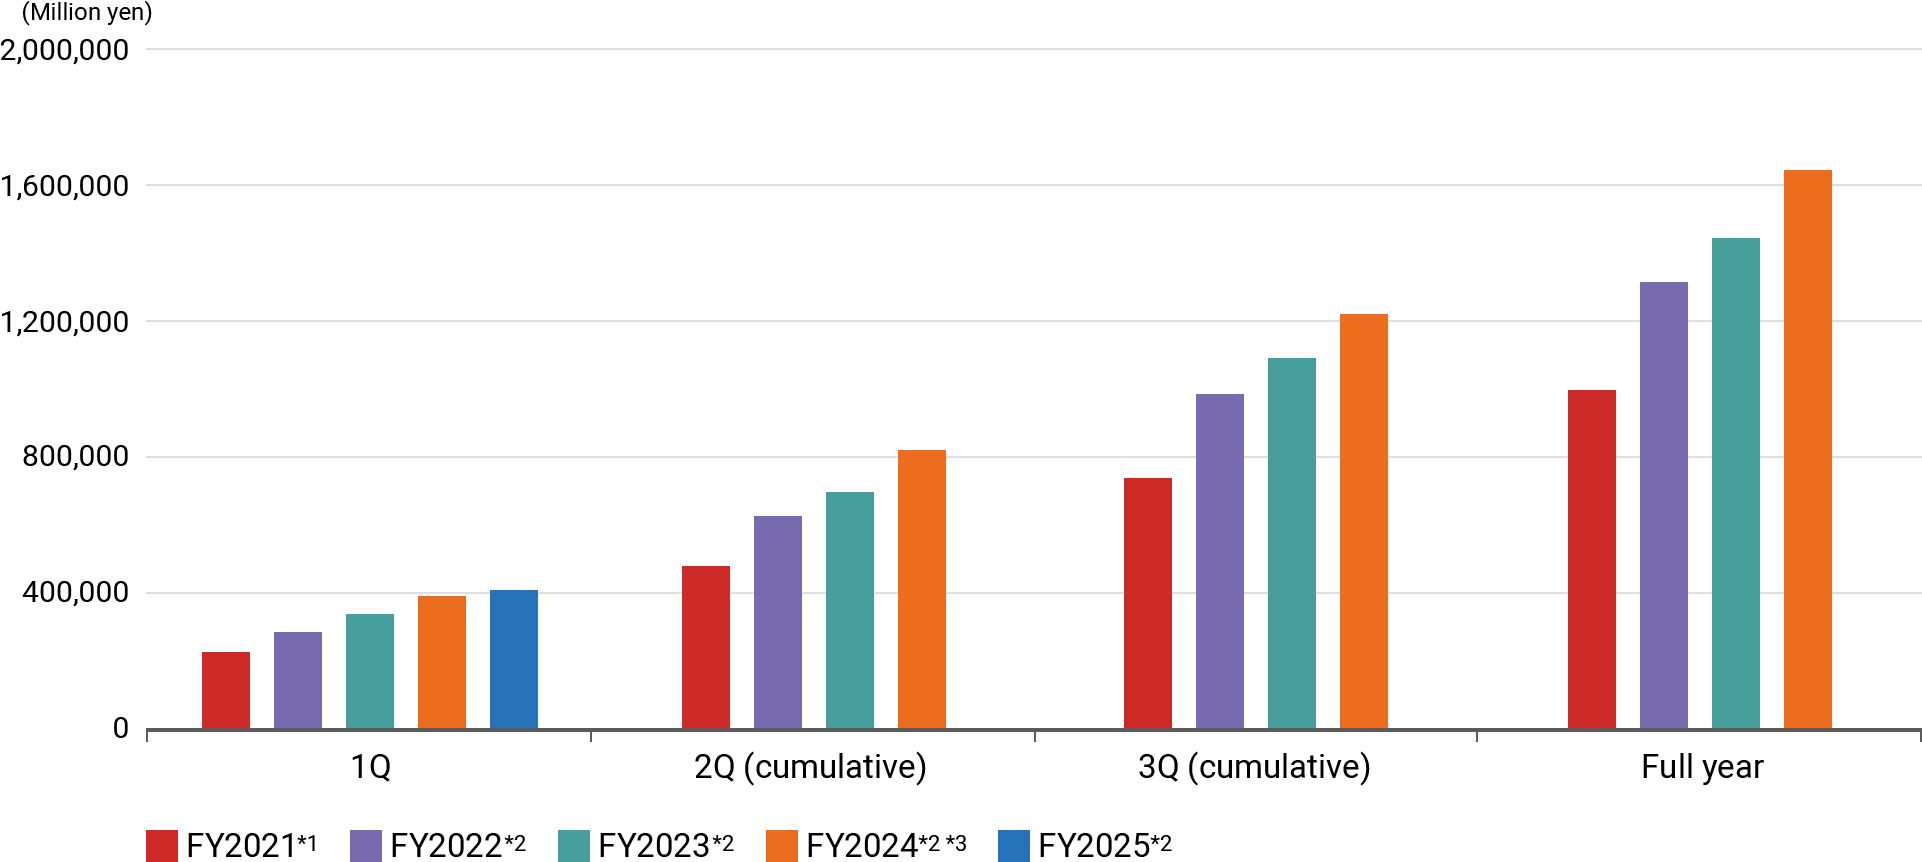
Revenue (cumulative results)
Our revenue growth has accelerated due to the accumulation of assets through multiple M&As executed since 2017, as well as the substantial growth of our decorative paints business in Asia, particularly in China. In 2023, we achieved seven consecutive years of revenue growth and record-high revenue, due to increased sales volumes and the flow-through of price increases, primarily in the decorative paints business, along with new consolidation of NPT and the yen's depreciation.
(Million yen)
|
|
1Q | 2Q (cumulative) | 3Q (cumulative) | Full year |
|---|---|---|---|---|
| FY2025*2 | 405,724 | - | - | - |
| FY2024*2 *3 | 384,319 | 817,143 | 1,222,747 | 1.638,720 |
| FY2023*2 | 330,213 | 692,925 | 1,085,878 | 1,442,574 |
| FY2022*2 | 285,096 | 622,049 | 979,916 | 1,309,021 |
| FY2021*1 | 222,678 | 481,787 | 736,257 | 998,276 |
*1: Following the business transfer to the Wuthelam Group announced on August 10, 2021, the European automotive coatings business and the two India businesses have been classified as discontinued operations. Figures for the 1Q FY2021, 3Q FY2021 cumulative period, and full-year FY2021 are the amounts for continuing operations excluding discontinued operations.
*2: Hyperinflation accounting has been applied for our Turkish subsidiaries beginning with FY2022 2Q. The figures for FY2022 and FY2023 are adjusted for the application of this accounting policy.
*3: Figures for FY2024 1Q has been restated retrospectively following the finalization of PPA for Alina (Kazakhstan). The same applies to following slides
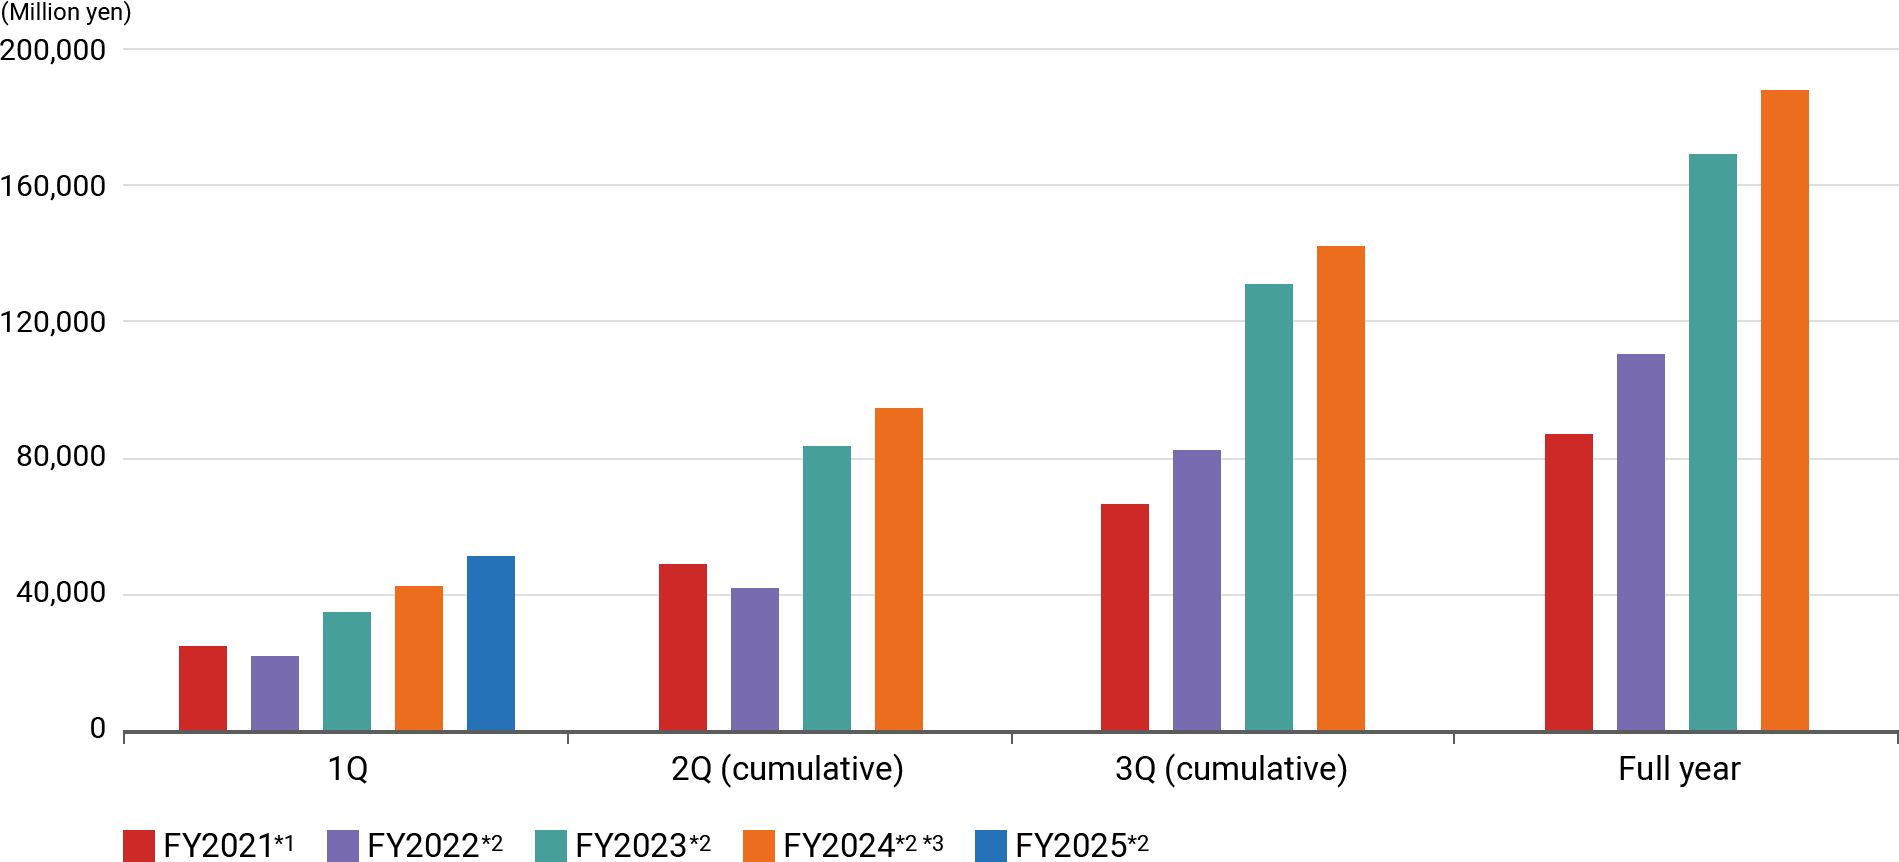
Operating profit (cumulative results)
Since 2020, our operating profit has seen growth for four consecutive years, keeping pace with our revenue increase. Despite the influence of hyperinflationary accounting in Türkiye, our operating profit reached a record high in 2023, thanks to the growth in revenue and improvement in gross profit margin.
(Million yen)
|
|
1Q | 2Q (cumulative) | 3Q (cumulative) | Full year |
|---|---|---|---|---|
| FY2025*2 | 51,432 | - | - | - |
| FY2024*2 *3 | 41,245 | 94,490 | 141,758 | 187,647 |
| FY2023*2 | 34,909 | 83,738 | 131,625 | 168,745 |
| FY2022*2 | 21,898 | 42,104 | 81,831 | 111,882 |
| FY2021*1 | 24,699 | 48,961 | 66,737 | 87,615 |
*1: Following the business transfer to the Wuthelam Group announced on August 10, 2021, the European automotive coatings business and the two India businesses have been classified as discontinued operations. The figures for FY2021 are amounts for continuing operations excluding discontinued operations. The figures for FY2021 have been adjusted to reflect a change in the accounting policy for configuration or customization costs in cloud computing agreements implemented beginning with 4Q FY2021.
*2: Hyperinflation accounting has been applied for our Turkish subsidiaries beginning with FY2022 2Q. The figures for FY2022 and FY2023 are adjusted for the application of this accounting policy.
*3: Figures for FY2024 1Q has been restated retrospectively following the finalization of PPA for Alina (Kazakhstan). The same applies to following slides
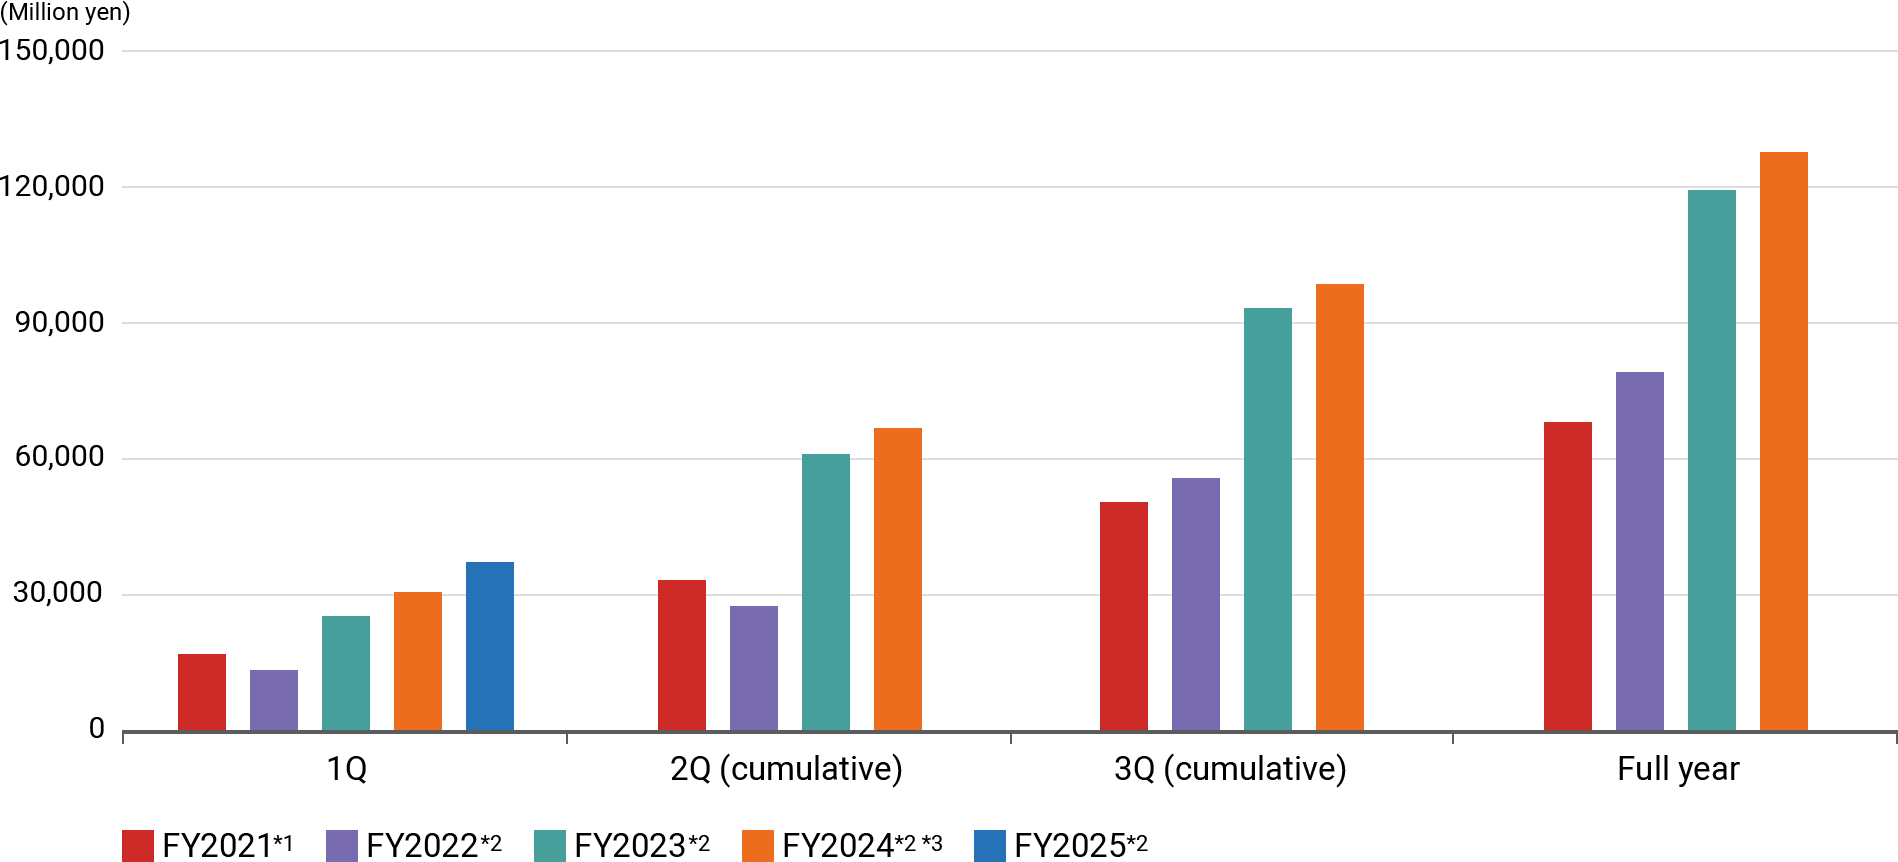
Profit attributable to owners of parent (cumulative results)
Profit attributable to owners of parent generally aligns with the trends in operating profit and various stages of profit. Since 2020, it has increased steadily for four consecutive years, driven by the growth in operating profit resulting from increased revenue.
(Million yen)
|
|
1Q | 2Q (cumulative) | 3Q (cumulative) | Full year |
|---|---|---|---|---|
| FY2025*2 | 36,998 | - | - | - |
| FY2024*2 *3 | 29,428 | 66,339 | 98,203 | 127,337 |
| FY2023*2 | 25,340 | 60,898 | 93,444 | 118,476 |
| FY2022*2 | 13,225 | 26,971 | 54,695 | 79,418 |
| FY2021*2 | 16,342 | 33,274 | 50,308 | 67,569 |
*1: The figures for FY2021 have been adjusted to reflect a change in the accounting policy for configuration or customization costs in cloud computing agreements implemented beginning with 4Q FY2021.
*2: Hyperinflation accounting has been applied for our Turkish subsidiaries beginning with FY2022 2Q. The figures for FY2022 and FY2023 are adjusted for the application of this accounting policy.
*3: Figures for FY2024 1Q has been restated retrospectively following the finalization of PPA for Alina (Kazakhstan). The same applies to following slides