


Latest Financial Results
Overview of Operating Results (January 1 – September 30, 2026)
For the nine months ended September 30, 2026, Nippon Paint Group’s consolidated revenue increased by 17.4% year-on-year to ¥1,547,335 million. This increase was primarily attributable to contributions from LSF11 A5 TopCo LLC (AOC), including AOC, LLC, a global specialty formulator, and its affiliated companies, following the completion of the acquisition in March 2025, together with higher sales volumes, an improved product mix, and favorable foreign exchange movements. Consolidated operating profit increased by 23.9% to ¥229,288 million, while profit before tax rose by 21.4% to ¥214,918 million. Profit attributable to owners of parent increased by 28.9%, reaching ¥167,691 million.

Revenue from automotive coatings increased year on year, supported by higher automobile production and the flow-through of selling price increases. Revenue from industrial coatings also increased, driven by a surge in demand ahead of steel sheet price increases and the flow-through of selling price increases. Revenue from decorative paints increased, reflecting demand arising from tight raw material supply, higher sales of high-durability products for architectural and structural applications, and the flow-through of selling price increases. As a result, consolidated revenue increased by 15.0% year-on-year to ¥174,103 million, while consolidated operating profit rose by 66.7% to ¥23,847 million.
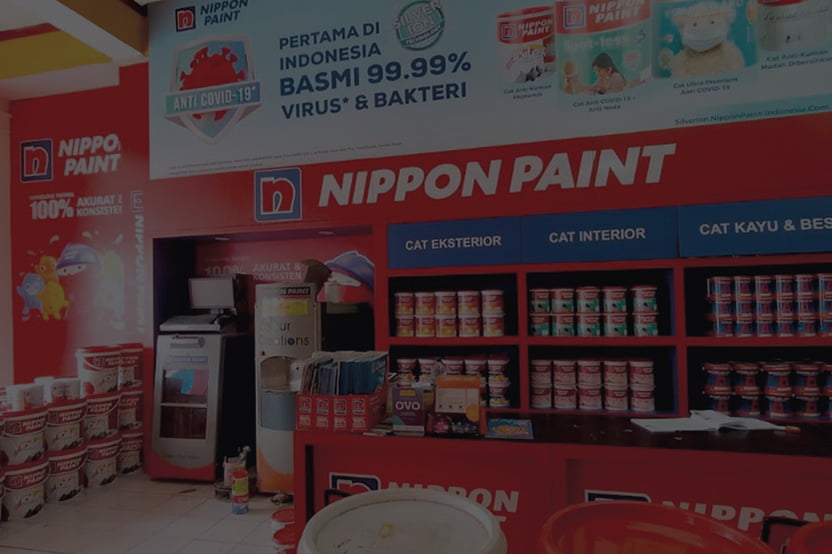
Revenue from automotive coatings in the NIPSEA segment increased year on year, as strong sales to Chinese OEMs more than offset lower automobile production in China and Thailand. Revenue from decorative paints also increased, driven by higher sales volumes in key markets, including Malaysia, Singapore, Thailand, and Indonesia. As a result, consolidated revenue increased by 12.8% year on year to ¥756,887 million, while consolidated operating profit rose by 17.6% to ¥123,985 million.
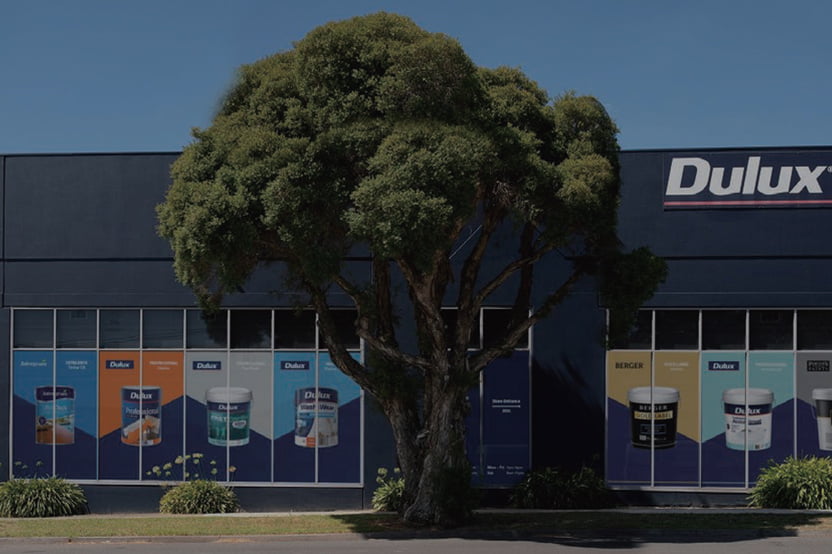
Revenue from decorative paints increased year on year, as market share gains in specialty coatings and growth in Southern and Central Europe more than offset challenging market conditions in the Pacific region and Europe. Revenue from the adjacencies business also increased, supported by contributions from small-scale acquisitions despite continued soft market conditions in the Pacific region and Europe. As a result, consolidated revenue increased by 20.4% year-on-year to ¥353,868 million, while consolidated operating profit rose by 3.7% to ¥30,285 million, despite business transformation costs recorded at Cromology Group.
*DuluxGroup Limited is an Australian company that owns the Dulux® trademark only in Australia, New Zealand, Papua New Guinea, Samoa and Fiji. DuluxGroup Limited is not associated with, and has no connection to, the owners of the Dulux® trademark in any other countries, nor does it sell Dulux® products in any other countries.

Revenue from automotive coatings increased year on year, as market share gains through new customer acquisitions more than offset lower automobile production. Revenue from decorative paints also increased, as the flow-through of selling price increases and favorable foreign exchange movements more than offset weaker demand amid uncertainty in the U.S. economy and continued softness in the housing market. As a result, consolidated revenue increased by 9.8% year-on-year to ¥99,387 million, while consolidated operating profit rose by 15.0% to ¥6,565 million.
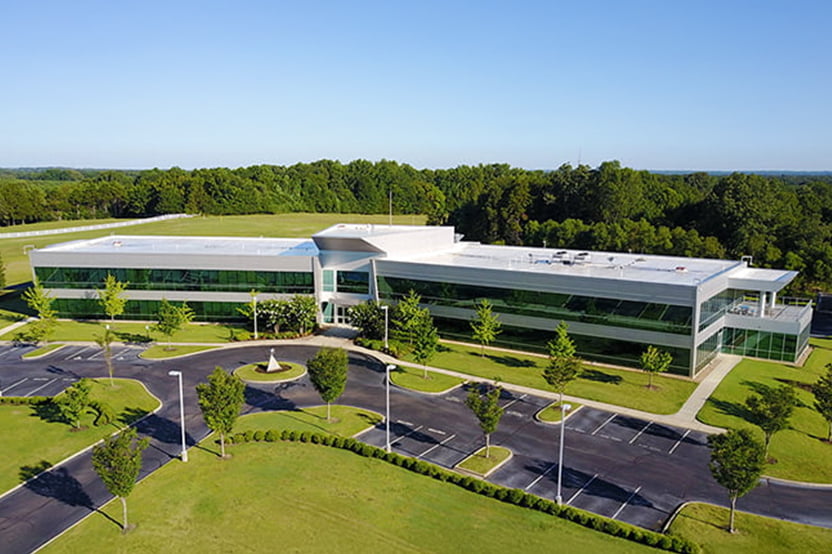
AOC’s operating results have been included in the Group’s consolidated results since March 2025. Revenue from the adjacencies business increased year on year, supported by higher sales volumes and the flow-through of selling price increases despite a continued challenging macroeconomic environment. As a result, consolidated revenue increased by 46.1% year on year to ¥163,088 million, while consolidated operating profit rose by 43.9% to ¥49,225 million.
Revenue Breakdown
- Revenue by Segment
-
Unit: %11.3% 48.9% 22.9% 6.4% 10.5%Share 100%
- ■Japan: 174,103 (11.3%)
- ■NIPSEA: 756,887 (48.9%)
- ■DuluxGroup: 353,868 (22.9%)
- ■Americas: 99,387 (6.4%)
- ■AOC: 163,088 (10.5%)
- Revenue by Business
-
Unit: %11.3% 55.5% 5.8% 1.0% 5.8% 20.6%Share 100%
- ■Automotive Coatings: 175,077 (11.3%)
- ■Decorative Paints: 858,633 (55.5%)
- ■Industrial Coatings: 89,273 (5.8%)
- ■Fine Chemicals: 15,659 (1.0%)
- ■Other Paints: 89,331 (5.8%)
- ■Adjacencies Business: 319,359 (20.6%)
Revenue
(Million yen)
| 1Q | 1H | 9M | FY | |
|---|---|---|---|---|
| FY2022 | 285,096 | 622,049 | 979,916 | 1,309,021 |
| FY2023 | 330,213 | 692,925 | 1,085,878 | 1,442,574 |
| FY2024 | 384,319 | 817,143 | 1,222,747 | 1,638,720 |
| FY2025 | 405,724 | 852,428 | 1,318,378 | 1,774,231 |
| FY2026 | 490,278 | 1,023,683 | 1,547,335 | – |
* Since FY2022 2Q, hyperinflationary accounting has been applied to the Turkish subsidiary. Figures from FY2022 onward reflect this accounting treatment.
Operating Profit
Nine months ended September 30, 2026
Consolidated operating profit increased by 23.9% to ¥229,288 million.
3Q (July–September 2026)
Operating profit was ¥76,973 million.
(Million yen)
| 1Q | 1H | 9M | FY | |
|---|---|---|---|---|
| FY2022 | 21,898 | 42,104 | 81,831 | 111,882 |
| FY2023 | 34,909 | 83,738 | 131,625 | 168,745 |
| FY2024 | 41,245 | 92,461 | 139,705 | 186,206 |
| FY2025 | 49,733 | 117,317 | 185,089 | 257,104 |
| FY2026 | 70,948 | 152,315 | 229,288 | – |
* Figures from FY2022 onward reflect hyperinflationary accounting applied to the Turkish subsidiary since FY2022 2Q.
* FY2022 quarterly figures were retrospectively adjusted following the finalization of PPA for Cromology and JUB.
* FY2024 quarterly figures were retrospectively adjusted following the finalization of PPA for Alina, NPI and BNPA.
* FY2025 comparative figures reflect the finalization of the provisional accounting treatment for a business combination at the end of FY2025.
Adjusted Operating Profit
Nine months ended September 30, 2026
Adjusted operating profit increased by 27.2% year-on-year to ¥256.6 billion, and the adjusted OP margin increased by 130 bps to 16.6%.
3Q (July–September 2026)
Adjusted operating profit increased by 15.3% year-on-year to ¥84.2 billion (organic: +15.3%, no inorganic contribution), driven by revenue growth and improved RMCC; the adjusted OP margin increased by 40 bps to 16.1%. Japan, NIPSEA Except China, DGL (Pacific), and the Americas: Both revenue and profit increased, driven by pricing pass-through and RMCC improvement. AOC: Revenue and profit increased, driven by price increases to offset rising raw material costs and favorable FX effects. NIPSEA China: A double-digit margin was achieved, despite continued market weakness and higher RMCC and SG&A ratios.
(Billion yen)
| 1Q | 1H | 9M | FY | |
|---|---|---|---|---|
| FY2023 | 37.9 | 88.7 | 140.1 | 182.2 |
| FY2024 | 46.6 | 101.0 | 152.3 | 200.7 |
| FY2025 | 55.9 | 128.7 | 201.8 | 278.1 |
| FY2026 | 77.5 | 172.4 | 256.6 | – |
* Adjusted operating profit is based on reported operating profit, excluding one-off and non-recurring items and the impact of hyperinflationary accounting. FX impacts and M&A contributions are included; subsidies, etc. are not excluded.
* Cumulative figures are calculated by adding the standalone quarterly figures (in billion yen) from the Appendix Reference Data. Minor differences from figures reported elsewhere may arise due to rounding.
* Starting from FY2026 2Q, depreciation of property, plant and equipment associated with PPA has been included as an adjustment item. Prior-year figures have also been retrospectively revised.
* FY2024 figures reflect PPA adjustments for Alina, NPI and BNPA; FY2025 figures reflect the finalization of AOC's PPA.
* Source: FY2026 3Q Financial Results Presentation Material, Appendix Reference Data, “Trends in Consolidated Financial Results and Key Financial Data.”
Profit Attributable to Owners of Parent
Nine months ended September 30, 2026
Profit attributable to owners of parent increased by 28.9% to ¥167,691 million.
3Q (July–September 2026)
Profit attributable to owners of parent was ¥62,541 million. EPS was ¥27.0, and adjusted EPS was ¥25.7.
(Million yen)
| 1Q | 1H | 9M | FY | |
|---|---|---|---|---|
| FY2022 | 13,225 | 26,971 | 54,695 | 79,418 |
| FY2023 | 25,340 | 60,898 | 93,444 | 118,476 |
| FY2024 | 29,428 | 65,049 | 96,902 | 125,890 |
| FY2025 | 35,698 | 84,502 | 130,135 | 179,800 |
| FY2026 | 51,524 | 105,150 | 167,691 | – |
* Figures from FY2022 onward reflect hyperinflationary accounting applied to the Turkish subsidiary since FY2022 2Q.
* FY2022 quarterly figures were retrospectively adjusted following the finalization of PPA for Cromology and JUB.
* FY2024 quarterly figures were retrospectively adjusted following the finalization of PPA for Alina, NPI and BNPA.
* FY2025 comparative figures reflect the finalization of the provisional accounting treatment for a business combination at the end of FY2025.

Nine months ended September 30, 2026
Revenue increased by 17.4% year-on-year to ¥1,547,335 million, supported by AOC contributions, higher sales volumes, an improved product mix, and favorable foreign exchange movements.
3Q (July–September 2026)
Revenue increased by 12.4% year-on-year to ¥523.7 billion, driven by improved product mix, growth in adjacencies business, and favorable FX effects.